
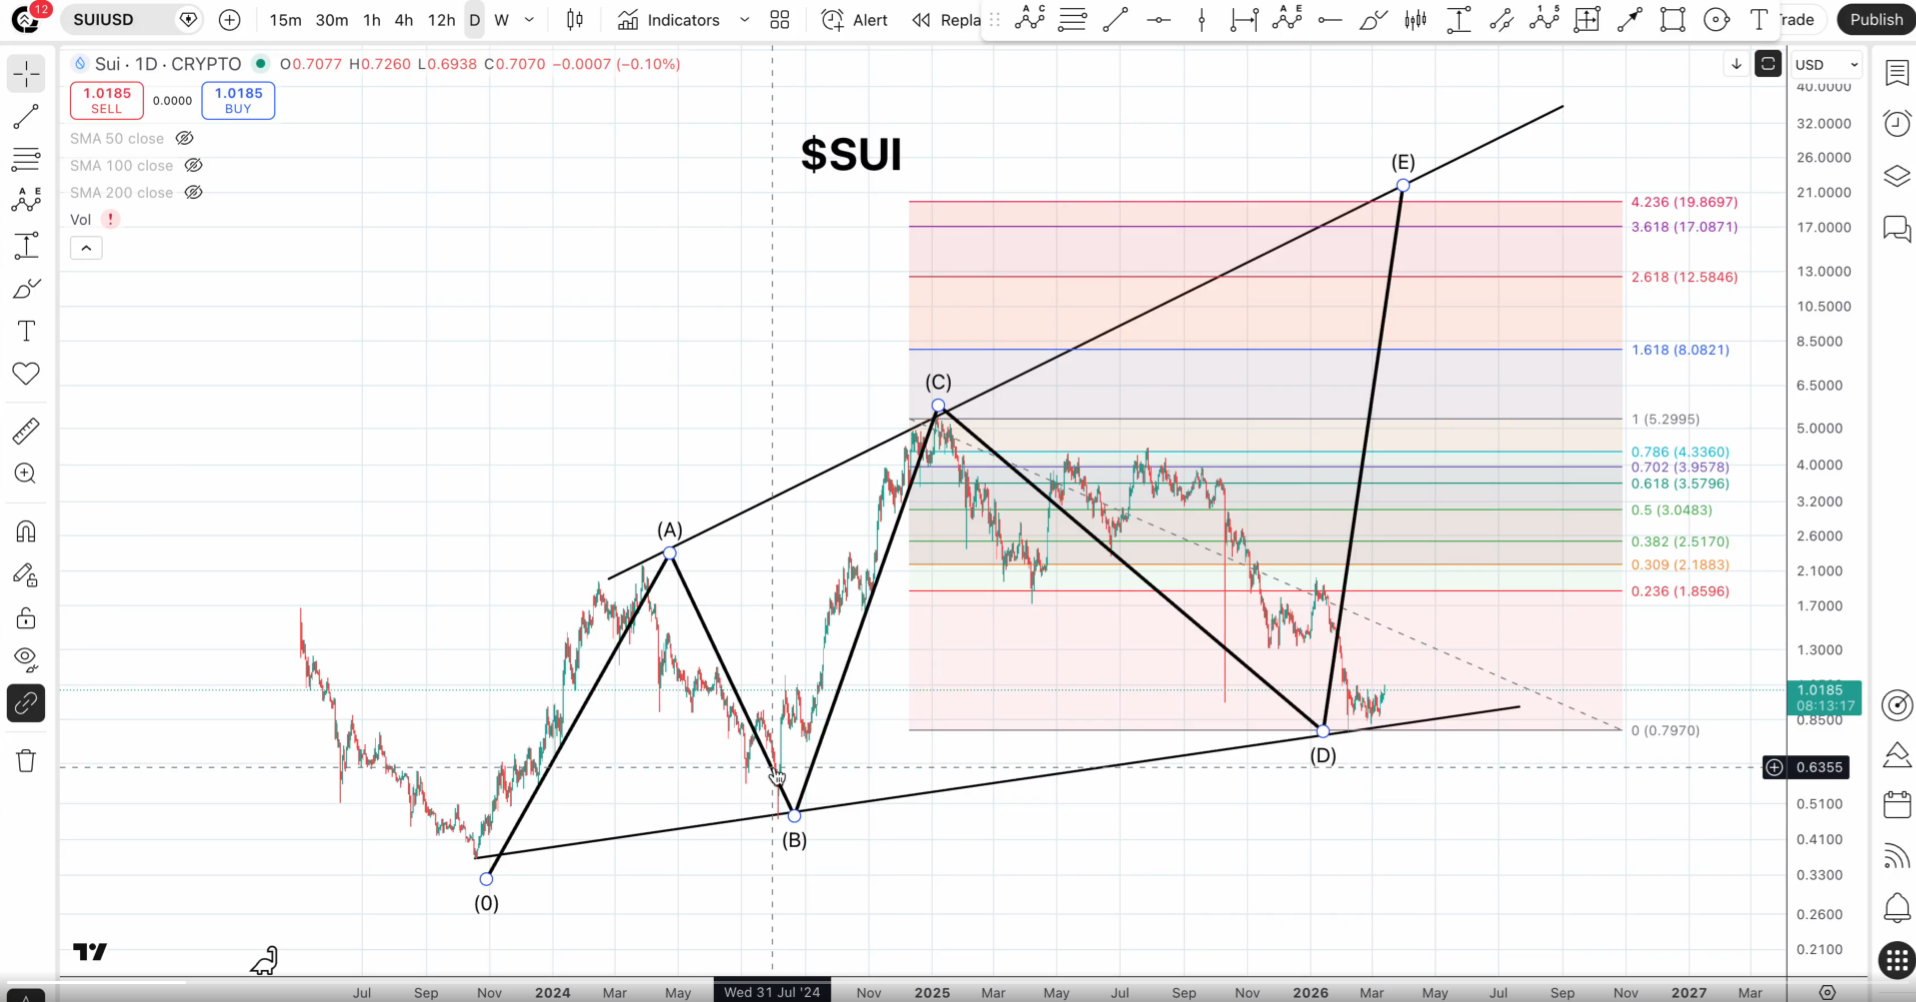
- Sui (SUI) is showing a textbook A-B-C-D-E technical structure, suggesting the token could be nearing the end of its correction phase.
- Price recently bounced from a key support zone near $0.7970, which aligns with the macro trendline support highlighted on the chart.
- Several Fibonacci resistance levels between $1.86 and $4.33 could act as major checkpoints if bullish momentum strengthens.
- If the projected E-wave expansion unfolds during the next altseason, analysts see potential upside targets around $8, $12, and even $20.
The cryptocurrency market is beginning to show early signs of recovery, with several altcoins forming promising bullish structures. Among them, Sui (SUI) has started attracting growing attention from analysts after a technical chart shared by @quantum_ascend on X highlighted a classic A-B-C-D-E wave structure that could potentially set the stage for a major rally.
At the time of writing, SUI is trading near $1.00, posting a weekly gain of around 11%. Despite the recent rebound, the token still remains roughly 81% below its all-time high, suggesting there may be significant upside potential if broader market conditions continue to improve.
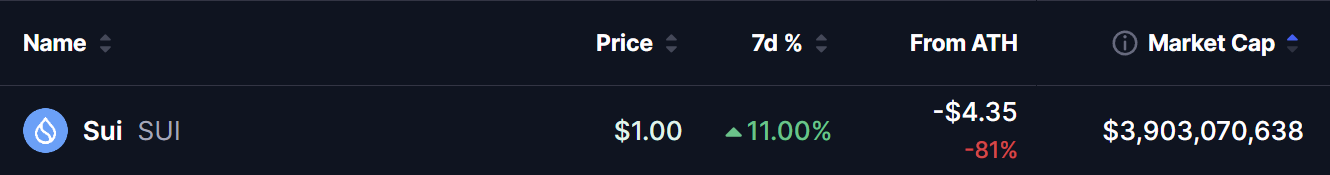
Currently holding a market capitalization of about $3.9 billion, SUI sits within the mid-cap segment of the crypto market. Over the past several months, its price action has remained volatile, with multiple attempts to reclaim higher resistance levels followed by renewed selling pressure.
However, the latest price structure now suggests that the asset could be forming a larger macro pattern, which many traders are closely monitoring as a possible accumulation phase before the next expansion move.
Chart Analysis: Textbook A-B-C-D-E Structure Emerges
The technical chart shared by analyst @quantum_ascend highlights a textbook A-B-C-D-E corrective structure, a formation often observed before a strong breakout phase.
According to the chart:
- Point A marked the first major bullish impulse following SUI’s early market bottom.
- Point B formed during a deep retracement that established a strong structural support zone.
- Point C represented the next major expansion, pushing SUI toward its cycle highs.
- Point D recently formed after a prolonged correction, where price rebounded from a key trendline support near $0.7970.
This D-point support zone around $0.79–$0.80 appears to be a critical level that could determine whether the broader bullish structure remains intact.
Key Fibonacci Levels
The chart also shows multiple Fibonacci retracement levels that could act as important resistance zones during a potential recovery:
- 0.236 Fib: ~$1.86
- 0.309 Fib: ~$2.18
- 0.382 Fib: ~$2.51
- 0.5 Fib: ~$3.04
- 0.618 Fib: ~$3.58
- 0.702 Fib: ~$3.95
- 0.786 Fib: ~$4.33
A successful reclaim of these levels could confirm strengthening bullish momentum.
Potential Upside Targets
If the E-wave expansion begins, Fibonacci extension targets highlighted on the chart suggest the following possible upside zones:
- 1.618 Extension: ~$8.08
- 2.618 Extension: ~$12.58
- 3.618 Extension: ~$17.08
- 4.236 Extension: ~$19.86 (≈ $20 Altseason Target)
These levels align with the analyst’s view that a full altcoin cycle could potentially push SUI toward the $20 region.
What Could Invalidate the Setup?
While the pattern looks technically promising, the bullish scenario could weaken if SUI loses the $0.79 support region, which currently represents the D-point structure and long-term trendline support.
A breakdown below this zone may indicate that the correction is still ongoing rather than complete.
Final Thoughts
SUI’s current price structure is beginning to attract attention across the crypto trading community. The A-B-C-D-E formation, combined with strong trendline support and Fibonacci confluence, suggests the asset may be approaching a pivotal phase.
If the pattern continues to develop as projected, the next impulsive E-wave could potentially push SUI toward higher extension targets, with $8, $12, and $20 emerging as major levels to watch during the next altcoin market expansion.
The opinions and market insights shared on CoinsProbe represent the views of individual authors based on prevailing market conditions at the time of publication. Cryptocurrency investments carry significant risk and volatility. Readers are encouraged to conduct their own research and seek professional financial advice before making investment decisions. CoinsProbe and its contributors do not accept responsibility for financial losses or decisions made based on published content.
CoinsProbe may publish sponsored articles, affiliate links, or promotional collaborations. All sponsored material is clearly labeled to maintain transparency with our audience. Our editorial decisions remain fully independent, and advertising partnerships do not influence reviews, rankings, or published opinions.
Since 2023, CoinsProbe has delivered reliable insights on cryptocurrency, blockchain, and digital assets. Our content is created by experienced researchers and analysts who follow strict editorial standards focused on accuracy, transparency, and credibility. Every article is carefully reviewed and verified using trusted sources and current market data. We provide unbiased analysis and timely updates covering everything from emerging crypto projects to major industry developments.