

Key Takeaways
- AAVE is forming a descending broadening wedge on the 4H chart — a bullish reversal structure.
- Strong demand emerged near the $92.69 support zone, triggering a rebound.
- Price is now approaching the upper resistance.
- A confirmed breakout from wedge could open the door toward the $207.31 target (~80% upside).
- The $111 area remains key short-term support if rejection occurs.
The broader cryptocurrency market is staging a strong rebound, with Bitcoin up 4% and Ethereum surging nearly 8% in the past 24 hours. This renewed optimism is lifting several major altcoins.
Meanwhile, Aave (AAVE) is trading slightly in the red today. However, beneath the surface, a developing chart structure suggests that momentum could soon shift in favor of the bulls.
Descending Broadening Wedge Pattern in Play
On the 4-hour timeframe, AAVE is trading within a descending broadening wedge — a pattern often associated with bullish reversals after extended corrective phases. Unlike traditional falling wedges, this structure shows expanding volatility, with price making lower lows and lower highs within widening trendlines.
During the recent pullback, AAVE dropped toward the $92.69 region, where strong demand quickly emerged. Buyers stepped in aggressively at this lower boundary of the wedge, triggering a sharp rebound.
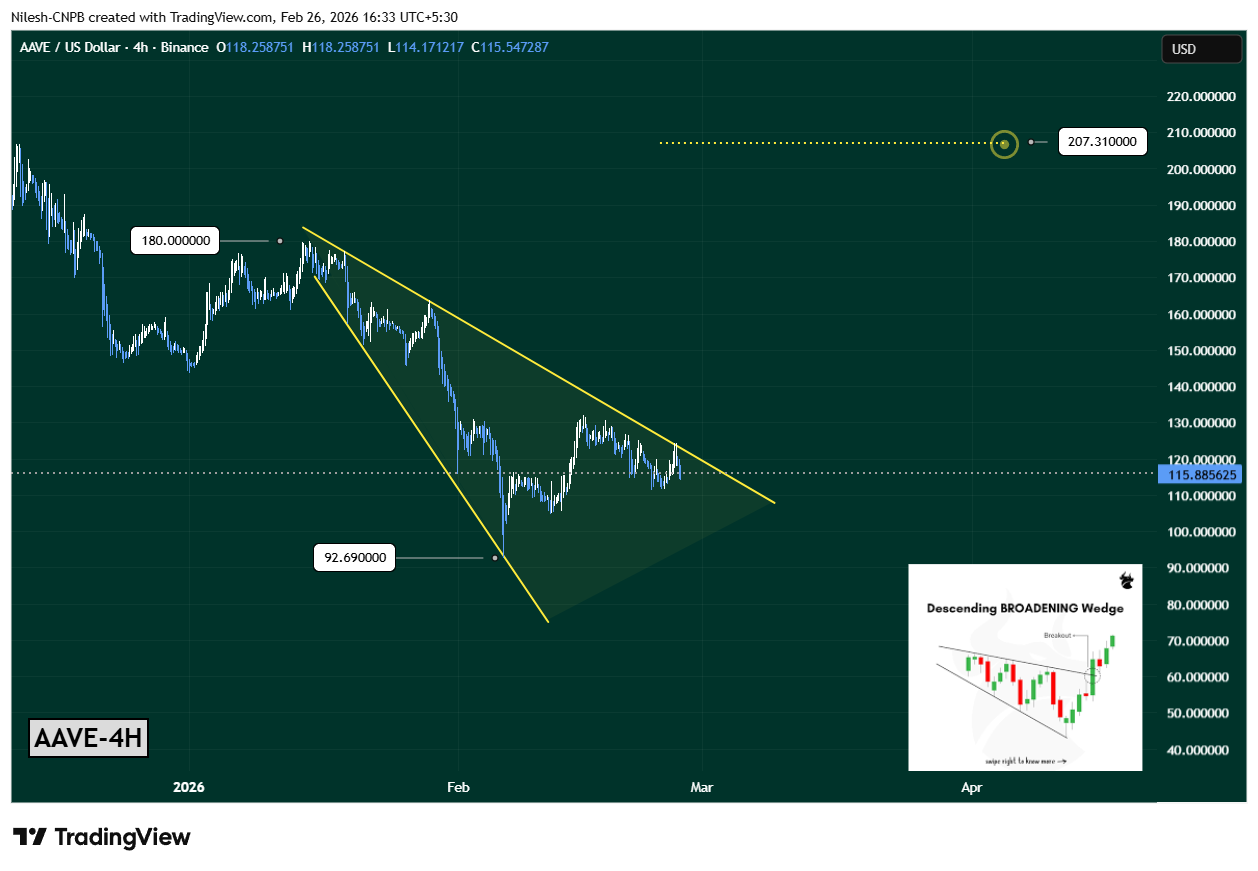
That bounce has now pushed price back toward the $115–$120 area, placing AAVE right near the wedge’s upper descending resistance trendline. The steady climb into resistance suggests growing breakout pressure, as repeated tests of a trendline often weaken it over time.
Importantly, market structure has improved since the rebound, with higher lows forming on lower timeframes — a subtle but meaningful shift in momentum.
What’s Next for AAVE?
The key level to watch is the $120 resistance zone, which aligns with the wedge’s upper boundary.
- A decisive breakout and strong close above this region would confirm the bullish wedge breakout.
- In that case, the measured move projection opens the door toward $207.31, representing roughly 80% upside from current levels.
Such a move would mark a major trend shift and likely attract fresh momentum traders and sidelined buyers.
However, if AAVE faces rejection at resistance, price may continue consolidating within the wedge. In that scenario, the $111 region becomes an important short-term support zone. Holding above this level would maintain bullish pressure and keep the breakout thesis alive.
For now, the structure favors a potential upside resolution — but confirmation above $120 will be the trigger that traders are waiting for.
Disclaimer: The views and analysis presented in this article are for informational purposes only and reflect the author’s perspective, not financial advice. Technical patterns and indicators discussed are subject to market volatility and may or may not yield the anticipated results. Investors are advised to exercise caution, conduct independent research, and make decisions aligned with their individual risk tolerance.
About Author: Nilesh Hembade is the Founder and Lead Author of Coinsprobe, with over 5 years of experience in the cryptocurrency and blockchain industry. Since launching Coinsprobe in 2023, he has been providing daily, research-driven insights through in-depth market analysis, on-chain data, and technical research.
The opinions and market insights shared on CoinsProbe represent the views of individual authors based on prevailing market conditions at the time of publication. Cryptocurrency investments carry significant risk and volatility. Readers are encouraged to conduct their own research and seek professional financial advice before making investment decisions. CoinsProbe and its contributors do not accept responsibility for financial losses or decisions made based on published content.
CoinsProbe may publish sponsored articles, affiliate links, or promotional collaborations. All sponsored material is clearly labeled to maintain transparency with our audience. Our editorial decisions remain fully independent, and advertising partnerships do not influence reviews, rankings, or published opinions.
Since 2023, CoinsProbe has delivered reliable insights on cryptocurrency, blockchain, and digital assets. Our content is created by experienced researchers and analysts who follow strict editorial standards focused on accuracy, transparency, and credibility. Every article is carefully reviewed and verified using trusted sources and current market data. We provide unbiased analysis and timely updates covering everything from emerging crypto projects to major industry developments.