
Key Takeaways
- SEI has completed another 82% correction within its long-term falling wedge pattern, mirroring previous bullish reversal setups.
- The token is currently testing major wedge support near $0.067, historically a high-reaction accumulation zone.
- A confirmed bullish reversal would require a reclaim of the 10-week moving average near $0.097, which could trigger a wedge breakout.
The broader altcoin market has been under intense pressure since September 2025, when Ethereum began its sharp decline from $4,700 to nearly $1,800. That heavy sell-off rippled across major altcoins — and Layer-1 token Sei was no exception.
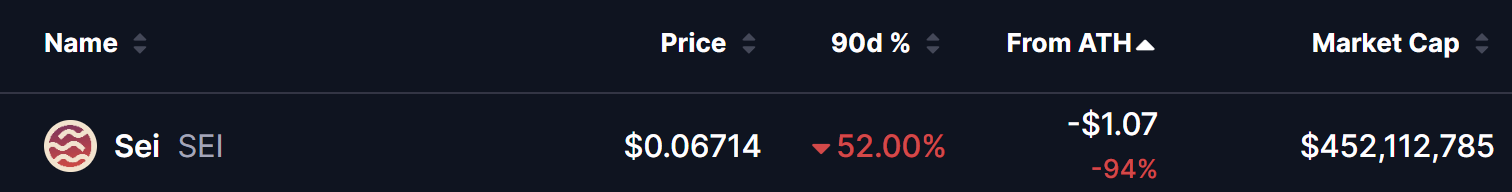
SEI has erased more than 50% of its value over the past 90 days and currently trades roughly 94% below its all-time high of $1.07. However, beneath this prolonged downtrend, a previously identified bearish fractal pattern has now played out almost perfectly — potentially setting the stage for a decisive move ahead.
SEI Completes Major Fractal Correction
On the weekly timeframe, SEI has been respecting a large falling wedge structure — a pattern we initially highlighted back in November 2025.
The latest leg of the correction began in September 2025 when SEI faced rejection at the upper boundary of the wedge near $0.35. That rejection triggered a breakdown below the 10-week moving average (10 MA), accelerating selling pressure. Since then, the token has plunged nearly 82%, dropping to around $0.067 — right near the lower boundary support of the wedge.
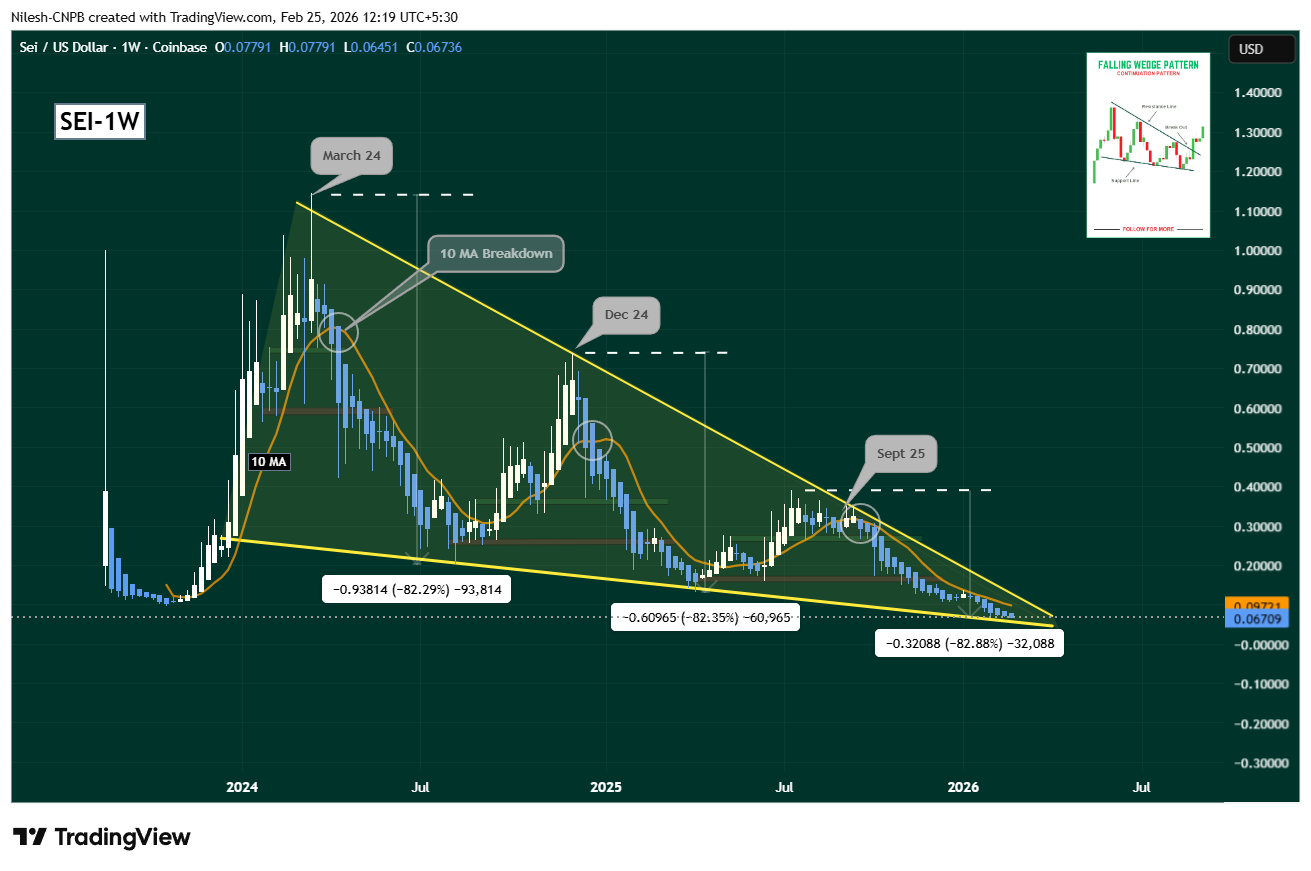
What makes this structure particularly interesting is how closely it mirrors previous price cycles:
- March 2024 fractal: Rejection at wedge resistance → 10 MA breakdown → ~82% correction → bullish reversal
- December 2024 fractal: Similar rejection → breakdown → ~82% drop → strong recovery
- September 2025–February 2026: Identical rejection and 82% decline toward wedge support
The symmetry is striking. Historically, each time SEI completed an ~82% correction within this wedge structure, it eventually marked a significant bottom before reversing upward.
Now, price is once again sitting at that historically reactive zone.
What Could Trigger a Bullish Reversal?
At the moment, SEI is hovering near $0.067, close to the lower boundary of the falling wedge — an area that could act as an accumulation zone if buyers step in.
However, confirmation is key.
For a meaningful bullish reversal, SEI must reclaim its 10-week moving average, currently positioned around $0.097. A decisive weekly close above this level would signal a shift in short-term momentum and could open the door for a breakout from the falling wedge pattern.
Falling wedges are traditionally bullish reversal structures, especially after extended downtrends. If the pattern confirms, SEI could attempt a move back toward the ma and a breakout above the wedge’s upper boundary would significantly strengthen the bullish case.
Key Risk to Watch
Despite the historical fractal alignment, traders should remain cautious.
Until SEI reclaims the 10-week MA, the broader trend remains bearish. Failure to hold the lower wedge boundary could invalidate the setup and expose the token to further downside or extended consolidation.
In simple terms:
The structure looks familiar. The correction magnitude matches prior cycles. But confirmation is still pending.
After an 82% drop, SEI is at a critical decision point. Whether history repeats itself or not will likely depend on one thing — momentum reclaim above the 10-week moving average.
For now, the chart suggests pressure may be exhausting. The next few weekly candles could determine whether SEI is preparing for recovery — or simply pausing before another leg lower.
Disclaimer: The views and analysis presented in this article are for informational purposes only and reflect the author’s perspective, not financial advice. Technical patterns and indicators discussed are subject to market volatility and may or may not yield the anticipated results. Investors are advised to exercise caution, conduct independent research, and make decisions aligned with their individual risk tolerance.
About Author: Nilesh Hembade is the Founder and Lead Author of Coinsprobe, with over 5 years of experience in the cryptocurrency and blockchain industry. Since launching Coinsprobe in 2023, he has been providing daily, research-driven insights through in-depth market analysis, on-chain data, and technical research.
The opinions and market insights shared on CoinsProbe represent the views of individual authors based on prevailing market conditions at the time of publication. Cryptocurrency investments carry significant risk and volatility. Readers are encouraged to conduct their own research and seek professional financial advice before making investment decisions. CoinsProbe and its contributors do not accept responsibility for financial losses or decisions made based on published content.
CoinsProbe may publish sponsored articles, affiliate links, or promotional collaborations. All sponsored material is clearly labeled to maintain transparency with our audience. Our editorial decisions remain fully independent, and advertising partnerships do not influence reviews, rankings, or published opinions.
Since 2023, CoinsProbe has delivered reliable insights on cryptocurrency, blockchain, and digital assets. Our content is created by experienced researchers and analysts who follow strict editorial standards focused on accuracy, transparency, and credibility. Every article is carefully reviewed and verified using trusted sources and current market data. We provide unbiased analysis and timely updates covering everything from emerging crypto projects to major industry developments.