
Key Takeaways
- Hyperliquid’s HIP-3 markets hit record highs, with daily trading volume surging to around $1.47 billion.
- Open interest (OI) reached an all-time high of $793 million, up sharply from $260 million just a month ago.
- Rising commodities trading activity is driving strong capital inflows into the Hyperliquid ecosystem.
- The daily chart highlights a Bearish Shark harmonic pattern, allowing room for short-term upside.
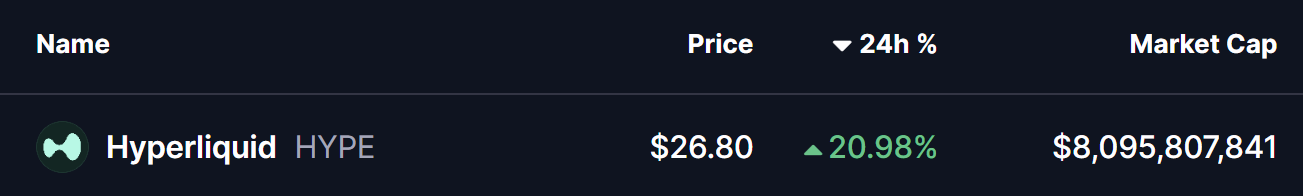
Hyperliquid’s native token HYPE is back in focus after posting a sharp 20%+ rally, pushing price toward the $26.80 level. While the move itself has caught traders’ attention, a closer look at on-chain growth and chart structure suggests this momentum may be backed by more than just short-term speculation.
Hyperliquid’s HIP-3 Markets Hit Record Highs
According to the latest data from Flowscan, Hyperliquid’s HIP-3 protocol — launched last fall to allow builders to deploy on-chain markets for commodities like gold and silver — is seeing explosive growth.
Daily trading volume across HIP-3 markets has surged to around $1.47 billion, marking a new all-time high. At the same time, open interest (OI) has climbed to a record $793 million, largely driven by a recent spike in commodities trading activity.
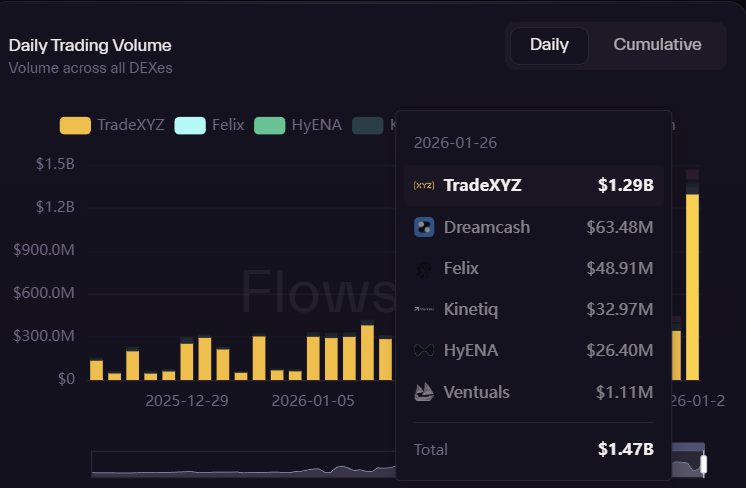
What stands out even more is the pace of growth. Just one month ago, HIP-3 open interest was sitting near $260 million. Since then, OI has been printing new weekly all-time highs, signaling rapidly increasing trader participation and capital inflows into the Hyperliquid ecosystem.
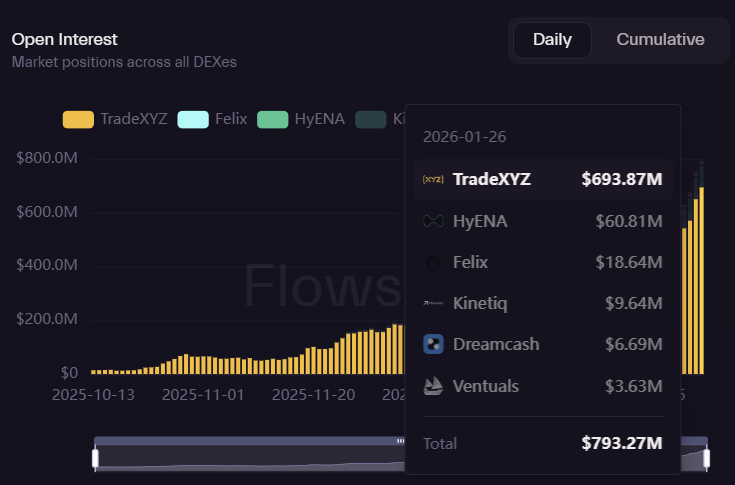
This sharp rise in volume and open interest highlights growing confidence in Hyperliquid’s on-chain derivatives infrastructure — a trend that often acts as a tailwind for the native token.
$HYPE To Rise Further?
From a technical perspective, HYPE’s daily chart is forming a Bearish Shark harmonic pattern — a structure that can appear during corrective phases but often allows for short-term bullish continuation before a larger reversal takes place.
After completing the O-X-A-B leg, HYPE managed to reclaim its 50-day moving average, an important shift in short-term momentum. The token is currently consolidating near the $23–$26 range, while facing its next major hurdle at the 100-day moving average around $31.67.
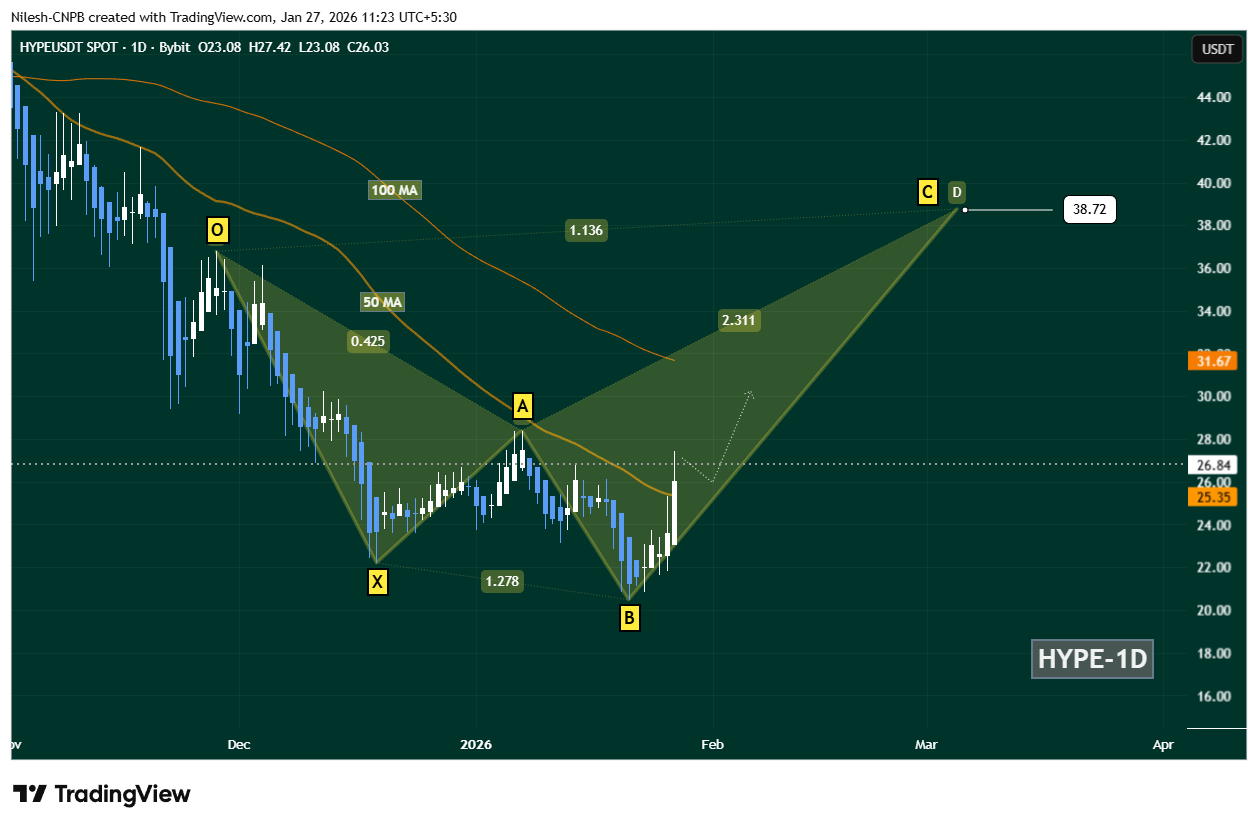
The key level to watch now is the 50-day MA support near $25.35. As long as HYPE holds above this zone, the bullish continuation scenario remains intact. A successful reclaim of the 100-day MA would significantly strengthen upside momentum.
If that breakout materializes, HYPE could advance toward the C-point of the Shark pattern near $38.72, which aligns with the 1.13 Fibonacci extension — a level often targeted during harmonic pattern completions.
Bottom Line
Hyperliquid’s fundamentals and technical structure are starting to align. Record-high HIP-3 trading volume, surging open interest, and renewed strength on the daily chart suggest that HYPE’s recent rally may not be a one-off move.
While resistance remains overhead near the 100-day moving average, continued support above the 50-day MA keeps the door open for further upside. If momentum holds and ecosystem growth continues at its current pace, HYPE could be positioning for another leg higher — with the $38 region emerging as a key level to watch in the weeks ahead.
Disclaimer: The views and analysis presented in this article are for informational purposes only and reflect the author’s perspective, not financial advice. Technical patterns and indicators discussed are subject to market volatility and may or may not yield the anticipated results. Investors are advised to exercise caution, conduct independent research, and make decisions aligned with their individual risk tolerance.
About Author: Nilesh Hembade is the Founder and Lead Author of Coinsprobe, with over 5 years of experience in the cryptocurrency and blockchain industry. Since launching Coinsprobe in 2023, he has been providing daily, research-driven insights through in-depth market analysis, on-chain data, and technical research.
The opinions and market insights shared on CoinsProbe represent the views of individual authors based on prevailing market conditions at the time of publication. Cryptocurrency investments carry significant risk and volatility. Readers are encouraged to conduct their own research and seek professional financial advice before making investment decisions. CoinsProbe and its contributors do not accept responsibility for financial losses or decisions made based on published content.
CoinsProbe may publish sponsored articles, affiliate links, or promotional collaborations. All sponsored material is clearly labeled to maintain transparency with our audience. Our editorial decisions remain fully independent, and advertising partnerships do not influence reviews, rankings, or published opinions.
Since 2023, CoinsProbe has delivered reliable insights on cryptocurrency, blockchain, and digital assets. Our content is created by experienced researchers and analysts who follow strict editorial standards focused on accuracy, transparency, and credibility. Every article is carefully reviewed and verified using trusted sources and current market data. We provide unbiased analysis and timely updates covering everything from emerging crypto projects to major industry developments.