Key Takeaways
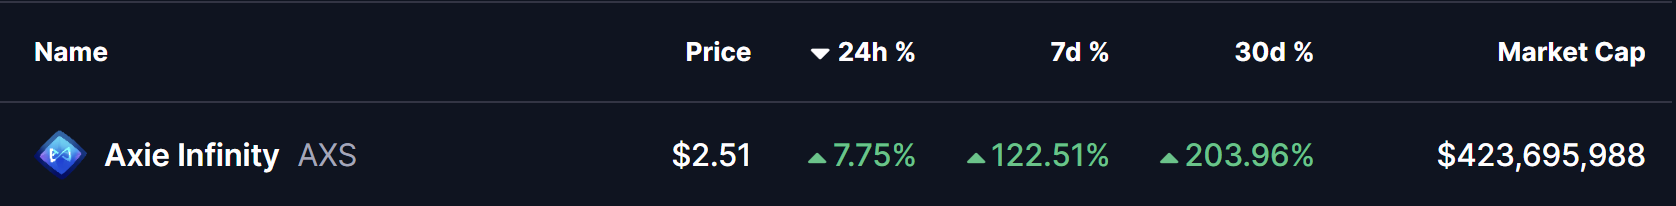
- Axie Infinity (AXS) has surged over 200% in the past 30 days, signaling strong renewed momentum.
- A major reward system overhaul by Jeff Zirlin is reducing sell pressure and encouraging long-term player participation.
- On the weekly chart, AXS remains inside a multi-year falling wedge, a structure that often precedes bullish breakouts.
Axie Infinity (AXS), the token behind the popular blockchain-based gaming ecosystem, has delivered a stunning comeback. Over the past 30 days, AXS has surged by nearly 204%, with price now hovering around the $2.50–$2.55 region. The rally has been especially aggressive in recent sessions, with gains of over 122% in the last week alone and an additional 7–8% move in the past 24 hours, backed by a clear rise in trading volume.
Beyond the short-term excitement, this move is gaining credibility as fundamental changes and long-term technical structures begin to align, suggesting that AXS may not just be experiencing a temporary bounce—but potentially the early stages of a much larger trend shift.
Reward System Overhaul Sparks Renewed Interest
One of the biggest catalysts behind the recent rally is Axie Infinity co-founder Jeff Zirlin’ major reward system update, announced in mid-January 2026. The update introduces a meaningful shift in how rewards are distributed and sold within the Axie ecosystem.
Key changes include the transition of in-game AXS rewards into bAXS, a non-tradable application token backed 1:1 by AXS. This new system ties rewards more closely to gameplay and staking activity while incorporating Axie Score and player reputation, meaning higher-quality players face lower selling fees. The objective is clear: reduce bot farming, limit speculative dumping, and reward genuine long-term participants.
Additional changes, such as halting SLP emissions in certain modes and broader tokenomic reforms planned for 2026, further strengthen the narrative that Axie Infinity is attempting to reset its economic model after years of inflationary pressure.
Long-Term Chart Signals a Potential Trend Reversal
From a technical perspective, the weekly AXS/USD chart paints an interesting picture. Since its peak during the 2021–2022 bull market, AXS has been locked inside a large falling wedge pattern—a structure that often precedes bullish reversals when price begins compressing near the lower boundary.
As shown on the chart, AXS has repeatedly respected both the upper and lower descending trendlines, forming a series of lower highs and lower lows over multiple years. Importantly, price is once again trading near the lower half of the wedge, a zone that has historically triggered sharp relief rallies and failed breakdown attempts.
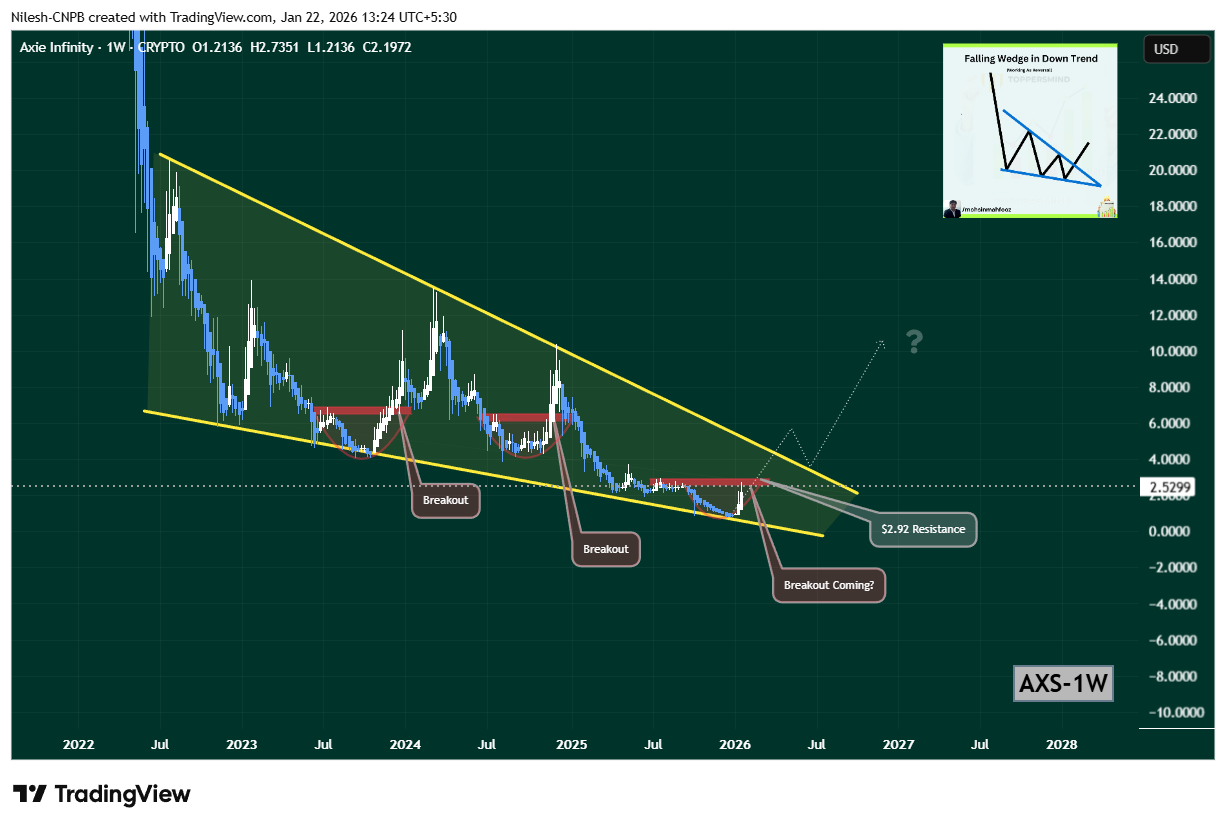
At present, AXS is consolidating just below the $2.90–$2.92 resistance zone, marked in red on the chart. Previous attempts to reclaim this area resulted in strong upside reactions, pushing price back toward the upper wedge boundary—an observation that closely mirrors current price behavior.
What’s Next for AXS?
For the bullish scenario to gain traction, AXS must decisively reclaim the $2.92 resistance level. A clean breakout above this zone would open the path toward the upper boundary of the falling wedge, setting the stage for a potential macro breakout that could shift long-term sentiment decisively bullish.
Until that level is cleared, some consolidation or short-term pullbacks remain possible. However, as long as price continues to hold above the wedge’s lower trendline and maintains higher lows, the broader structure remains constructive.
In simple terms, AXS is approaching a decision point. A confirmed breakout above resistance could trigger a powerful continuation rally, while failure to do so would likely result in more sideways accumulation. For now, all eyes remain on the $2.92 level as traders wait to see whether Axie Infinity is ready to turn this explosive recovery into a sustained bullish breakout.
Disclaimer: The views and analysis presented in this article are for informational purposes only and reflect the author’s perspective, not financial advice. Technical patterns and indicators discussed are subject to market volatility and may or may not yield the anticipated results. Investors are advised to exercise caution, conduct independent research, and make decisions aligned with their individual risk tolerance.
About Author: Nilesh Hembade is the Founder and Lead Author of Coinsprobe, with over 5 years of experience in the cryptocurrency and blockchain industry. Since launching Coinsprobe in 2023, he has been providing daily, research-driven insights through in-depth market analysis, on-chain data, and technical research.
The opinions and market insights shared on CoinsProbe represent the views of individual authors based on prevailing market conditions at the time of publication. Cryptocurrency investments carry significant risk and volatility. Readers are encouraged to conduct their own research and seek professional financial advice before making investment decisions. CoinsProbe and its contributors do not accept responsibility for financial losses or decisions made based on published content.
CoinsProbe may publish sponsored articles, affiliate links, or promotional collaborations. All sponsored material is clearly labeled to maintain transparency with our audience. Our editorial decisions remain fully independent, and advertising partnerships do not influence reviews, rankings, or published opinions.
Since 2023, CoinsProbe has delivered reliable insights on cryptocurrency, blockchain, and digital assets. Our content is created by experienced researchers and analysts who follow strict editorial standards focused on accuracy, transparency, and credibility. Every article is carefully reviewed and verified using trusted sources and current market data. We provide unbiased analysis and timely updates covering everything from emerging crypto projects to major industry developments.