
Key Takeaways
- Hyperliquid (HYPE) has dropped over 19% on the week, with price stabilizing near a critical demand zone.
- The $19.22–$19.55 support area is emerging as a key level where sellers may lose control.
- A bearish Shark harmonic pattern is forming on the daily chart, hinting at a potential rebound if support holds.
- Strong token burns and notable whale buying are acting as a contrarian signal amid broader weakness.
- A reclaim of the 50-day moving average near $26.39 could confirm a bullish recovery phase.
Hyperliquid’s native token, HYPE, remains under sustained selling pressure as bearish momentum continues to dominate short-term price action. As of January 21, HYPE is trading nearly 9% lower on the day, extending its weekly decline to over 19%. The token is currently hovering around the $20.65 region, an area that is quickly becoming a decisive technical battleground.
While the chart reflects heavy downside pressure, a mix of aggressive supply reduction, strategic buying, and an emerging harmonic structure is raising the question: Is a rebound quietly setting up beneath the surface?

Burn and Buying Add a Contrarian Signal
Despite the ongoing price weakness, on-chain activity tells a more nuanced story.
As of January 21, Hyperliquid’s assistance fund burned 39 million HYPE tokens, permanently removing roughly 3.9% of the maximum supply from circulation. At the same time, notable buyers stepped in during the sell-off.

- Arthur Hayes reportedly purchased 19,000 HYPE
- The assistance fund itself continues to buy aggressively, paying prices over 50% higher than current market levels
This combination of sustained burning and dip-buying suggests growing long-term conviction, even as short-term sentiment remains fragile.
Could This Emerging Pattern Trigger a Rebound?
From a technical perspective, the daily chart shows HYPE entering the early stages of a bearish Shark harmonic pattern.
After completing the O-X-A leg, price rolled over and is now pressing toward the projected B-point support zone between $19.22 and $19.55. This area is highlighted on the chart as a historically reactive demand zone and could mark a potential exhaustion point for sellers.
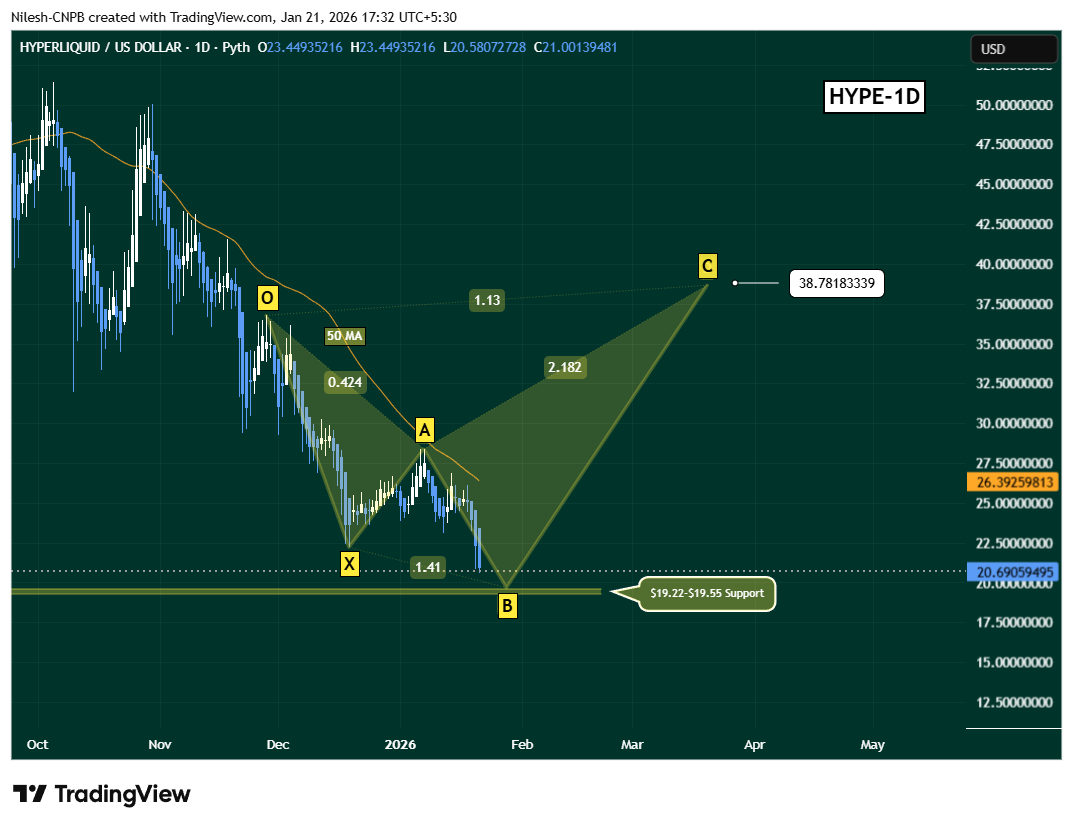
If buyers step in around this support and price begins to stabilize, the next key technical hurdle would be a reclaim of the 50-day moving average near $26.39. A decisive move back above this level would strengthen the rebound thesis and open the door for a recovery move toward the C-point near $38.7, where the Shark pattern’s projected extension sits around the 1.13 level.
What’s Next for HYPE?
For now, the pattern remains in development, not confirmed. The coming sessions will be critical.
- Holding the $19.22–$19.55 zone would keep the harmonic setup alive
- Rising volume and stronger daily closes could signal buyer commitment
- A break back above the 50-day MA would act as early confirmation of a trend shift
On the downside, a failure to hold the lower support zone would invalidate the pattern and leave HYPE vulnerable to deeper consolidation.
For now, Hyperliquid sits at a technical inflection point, where intense selling pressure collides with supply destruction and early structural support. Whether this develops into a meaningful rebound or another leg lower will depend on how price reacts at the lower boundary in the days ahead.
Disclaimer: The views and analysis presented in this article are for informational purposes only and reflect the author’s perspective, not financial advice. Technical patterns and indicators discussed are subject to market volatility and may or may not yield the anticipated results. Investors are advised to exercise caution, conduct independent research, and make decisions aligned with their individual risk tolerance.
About Author: Nilesh Hembade is the Founder and Lead Author of Coinsprobe, with over 5 years of experience in the cryptocurrency and blockchain industry. Since launching Coinsprobe in 2023, he has been providing daily, research-driven insights through in-depth market analysis, on-chain data, and technical research.
The opinions and market insights shared on CoinsProbe represent the views of individual authors based on prevailing market conditions at the time of publication. Cryptocurrency investments carry significant risk and volatility. Readers are encouraged to conduct their own research and seek professional financial advice before making investment decisions. CoinsProbe and its contributors do not accept responsibility for financial losses or decisions made based on published content.
CoinsProbe may publish sponsored articles, affiliate links, or promotional collaborations. All sponsored material is clearly labeled to maintain transparency with our audience. Our editorial decisions remain fully independent, and advertising partnerships do not influence reviews, rankings, or published opinions.
Since 2023, CoinsProbe has delivered reliable insights on cryptocurrency, blockchain, and digital assets. Our content is created by experienced researchers and analysts who follow strict editorial standards focused on accuracy, transparency, and credibility. Every article is carefully reviewed and verified using trusted sources and current market data. We provide unbiased analysis and timely updates covering everything from emerging crypto projects to major industry developments.