

Key Takeaways
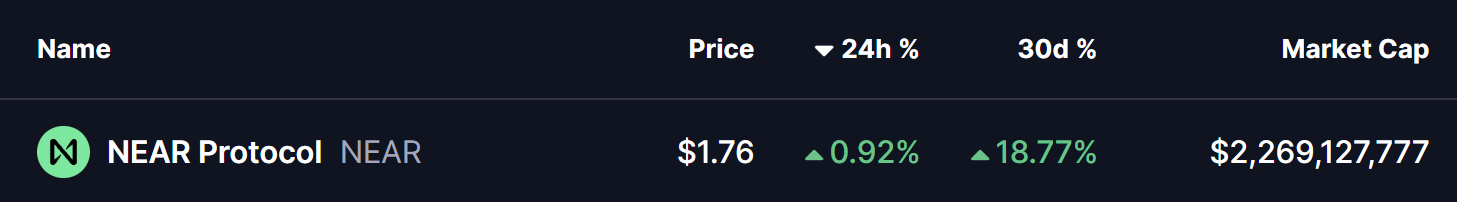
- Near Protocol (NEAR) is gaining momentum, with price up nearly 18% over the past 30 days.
- The daily chart shows a well-defined inverse head and shoulders pattern, signaling a potential bullish reversal.
- NEAR is consolidating just below a key neckline resistance zone between $1.79 and $1.88.
- Reclaiming the 100-day moving average near $1.96 would strengthen the bullish breakout case.
- A confirmed breakout could open the door toward the $2.36 upside target.
- Failure to hold above the $1.65 support zone may lead to further consolidation and delay the bullish setup.
The cryptocurrency market’s AI narrative has been gaining renewed traction, and Near Protocol (NEAR) is emerging as one of the standout performers. Over the past 30 days, NEAR has surged nearly 18%, and beyond the price action, the project continues to strengthen fundamentally.
NEAR currently ranked as the third most active blockchain by 38.9 monthly users, trailing only BNB Chain and Solana — a signal that on-chain usage and developer activity remain strong.

More importantly, the daily chart is now revealing a classic bullish reversal structure, suggesting that NEAR could be positioning itself for a meaningful upside continuation.
Inverse Head and Shoulders Pattern Takes Shape
On the daily timeframe, NEAR has formed a well-defined inverse head and shoulders pattern, a setup widely regarded as one of the most reliable bullish reversal formations in technical analysis.
- The left shoulder developed in early December near the $1.65 region, where selling pressure temporarily paused.
- This was followed by a deeper decline toward the $1.45 area, forming the head, as broader market weakness weighed on price.
- The right shoulder then emerged as NEAR once again found support near $1.65, signaling that sellers were losing control.
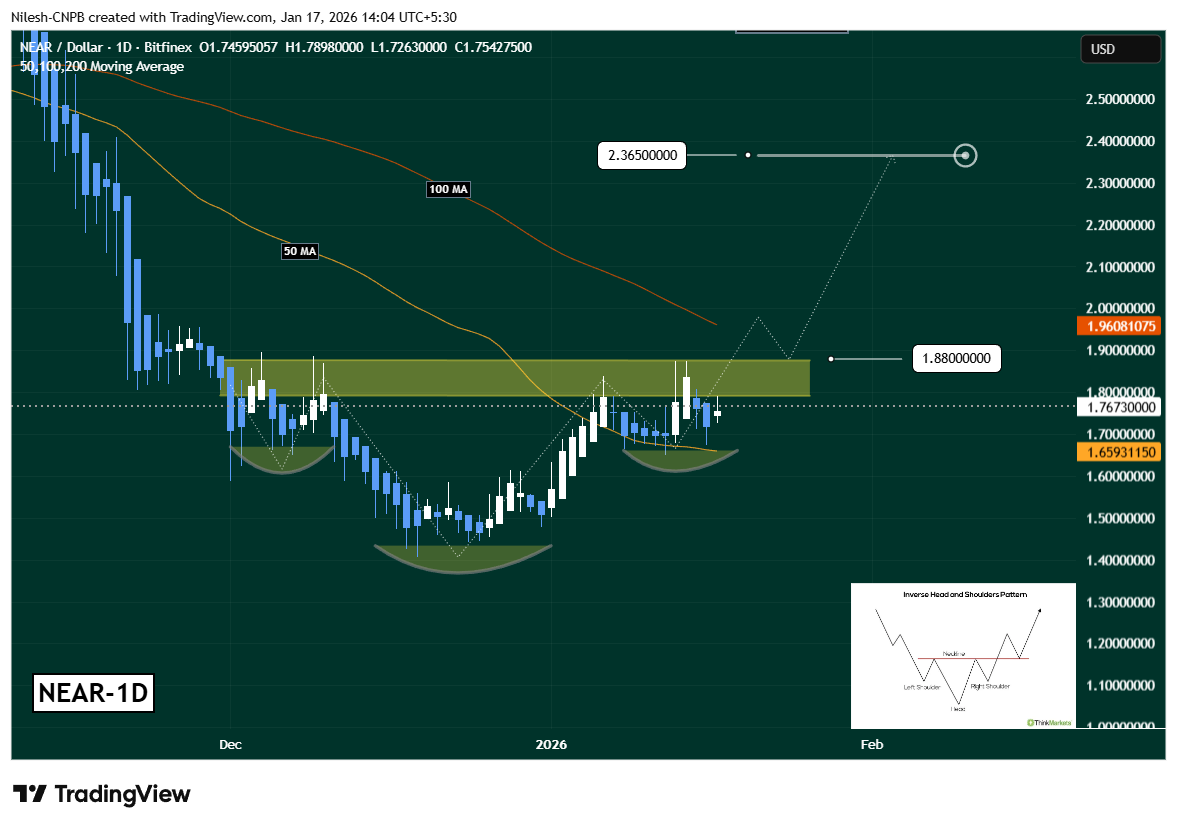
Since completing this structure, NEAR has rebounded steadily and successfully reclaimed the 50-day moving average, which is now acting as dynamic support. At present, price is consolidating just below a key neckline resistance zone between $1.79 and $1.88, clearly highlighted on the chart.
This compression near resistance often precedes a volatility expansion, suggesting that a decisive move could be approaching.
What’s Next for NEAR?
For bullish momentum to gain confirmation, NEAR needs a strong daily close above the $1.79–$1.88 neckline, ideally followed by a successful retest of this zone as support. Such a move would validate the inverse head and shoulders breakout and confirm a shift in short-term market structure.
Additional strength would come from reclaiming the 100-day moving average near $1.96, which has capped price during the recent downtrend. A break above this level could accelerate upside momentum as sidelined buyers step back in.
If these conditions are met, the measured move projection from the inverse head and shoulders pattern points toward the $2.36 region, representing a potential upside of roughly 26% from the breakout area.
On the downside, failure to clear the neckline could lead to further consolidation. In that scenario, holding above the 50-day moving average and the $1.65 support zone will be crucial to keep the bullish structure intact. A loss of these levels would delay the breakout thesis and shift focus back to range-bound price action.
Bottom Line
NEAR Protocol appears to be coiling beneath resistance, supported by a textbook bullish reversal pattern and improving broader sentiment. While confirmation is still needed, the technical structure suggests accumulation rather than distribution, with buyers gradually gaining control.
Disclaimer: The views and analysis presented in this article are for informational purposes only and reflect the author’s perspective, not financial advice. Technical patterns and indicators discussed are subject to market volatility and may or may not yield the anticipated results. Investors are advised to exercise caution, conduct independent research, and make decisions aligned with their individual risk tolerance.
About Author: Nilesh Hembade is the Founder and Lead Author of Coinsprobe, with over 5 years of experience in the cryptocurrency and blockchain industry. Since launching Coinsprobe in 2023, he has been providing daily, research-driven insights through in-depth market analysis, on-chain data, and technical research.
The opinions and market insights shared on CoinsProbe represent the views of individual authors based on prevailing market conditions at the time of publication. Cryptocurrency investments carry significant risk and volatility. Readers are encouraged to conduct their own research and seek professional financial advice before making investment decisions. CoinsProbe and its contributors do not accept responsibility for financial losses or decisions made based on published content.
CoinsProbe may publish sponsored articles, affiliate links, or promotional collaborations. All sponsored material is clearly labeled to maintain transparency with our audience. Our editorial decisions remain fully independent, and advertising partnerships do not influence reviews, rankings, or published opinions.
Since 2023, CoinsProbe has delivered reliable insights on cryptocurrency, blockchain, and digital assets. Our content is created by experienced researchers and analysts who follow strict editorial standards focused on accuracy, transparency, and credibility. Every article is carefully reviewed and verified using trusted sources and current market data. We provide unbiased analysis and timely updates covering everything from emerging crypto projects to major industry developments.