
Date: 10 Jan 2026, 06:25 AM GMT
The broader cryptocurrency market is taking a breather after a strong start to the year. Bitcoin (BTC), which surged close to the $94,000 level earlier this week, has slipped back toward $90,000, dragging overall market sentiment slightly lower. Ethereum (ETH) is also under pressure, with both major assets trading in the red today amid modest pullbacks.
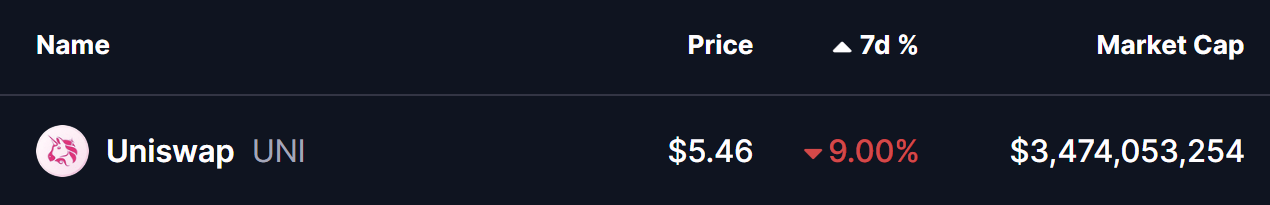
Against this backdrop, Uniswap ($UNI) is also facing selling pressure, down nearly 8% over the past week. However, beneath the surface, UNI’s price structure is beginning to show early signs of a potential bullish reversal if key levels are reclaimed.
Power of 3 Structure Emerging on the 4H Chart
From a technical perspective, UNI’s 4-hour chart is shaping into a classic Power of 3 (PO3) pattern — a structure often seen around market turning points and trend transitions. This pattern typically unfolds in three stages: accumulation, manipulation, and expansion, with the most aggressive move usually occurring once the final phase begins.
Accumulation Phase
As shown on the chart, UNI previously spent a prolonged period moving sideways within a clearly defined range. Price was capped near the $6.42 resistance zone, while buyers consistently stepped in around the $5.61 support area. This range-bound behavior reflected steady accumulation, with neither bulls nor bears able to establish a decisive trend.
Manipulation Phase
During the recent market-wide pullback, UNI broke sharply below the $5.61 accumulation support and slid toward a local low near $5.34. This move — highlighted by the red-shaded area on the chart — fits well with the manipulation phase of the Power of 3 structure. Such breakdowns are often designed to trigger stop losses, shake out weak hands, and push sentiment into pessimistic territory.

Encouragingly, selling pressure has started to fade near this zone. UNI has stabilized and is now trading back around $5.46, suggesting that downside momentum may be losing strength.
What Comes Next for UNI?
At present, UNI remains in the lower portion of the structure, trading just below the critical $5.61 level, which now acts as a major decision zone. This level previously served as accumulation support and will be key in determining whether bulls can regain control.
For the bullish scenario to gain traction, UNI needs to reclaim $5.61 and follow through with a move above the 100-period moving average near $5.87. A sustained recovery above these levels would signal a shift into the expansion phase of the Power of 3 setup, where upside momentum typically accelerates.
If buyers succeed in pushing price through this resistance cluster, the broader chart projection opens the door for a move toward the $7.50 region in the weeks ahead — an area that aligns with prior structural resistance highlighted on the chart.
That said, the setup remains conditional. As long as UNI continues to trade below $5.61, downside risks cannot be fully ruled out, and volatility may persist. Holding current lows and reclaiming key resistance zones will be critical for bulls to confirm a broader trend reversal.
Disclaimer: The views and analysis presented in this article are for informational purposes only and reflect the author’s perspective, not financial advice. Technical patterns and indicators discussed are subject to market volatility and may or may not yield the anticipated results. Investors are advised to exercise caution, conduct independent research, and make decisions aligned with their individual risk tolerance.
About Author: Nilesh Hembade is the Founder and Lead Author of Coinsprobe, with over 5 years of experience in the cryptocurrency and blockchain industry. Since launching Coinsprobe in 2023, he has been providing daily, research-driven insights through in-depth market analysis, on-chain data, and technical research.
The opinions and market insights shared on CoinsProbe represent the views of individual authors based on prevailing market conditions at the time of publication. Cryptocurrency investments carry significant risk and volatility. Readers are encouraged to conduct their own research and seek professional financial advice before making investment decisions. CoinsProbe and its contributors do not accept responsibility for financial losses or decisions made based on published content.
CoinsProbe may publish sponsored articles, affiliate links, or promotional collaborations. All sponsored material is clearly labeled to maintain transparency with our audience. Our editorial decisions remain fully independent, and advertising partnerships do not influence reviews, rankings, or published opinions.
Since 2023, CoinsProbe has delivered reliable insights on cryptocurrency, blockchain, and digital assets. Our content is created by experienced researchers and analysts who follow strict editorial standards focused on accuracy, transparency, and credibility. Every article is carefully reviewed and verified using trusted sources and current market data. We provide unbiased analysis and timely updates covering everything from emerging crypto projects to major industry developments.