
The broader cryptocurrency market continues to struggle with uneven and choppy price action, a phase that began after the sharp sell-off on October 10. That correction dragged Ethereum (ETH) lower by nearly 25% over the past 60 days, keeping risk appetite muted across the altcoin space. Solana (SOL) has not been immune to this pressure, remaining under sustained selling as market participants stay cautious.
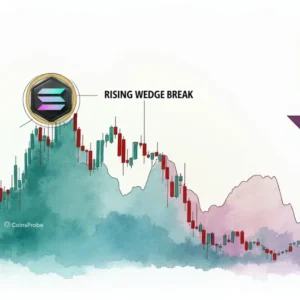
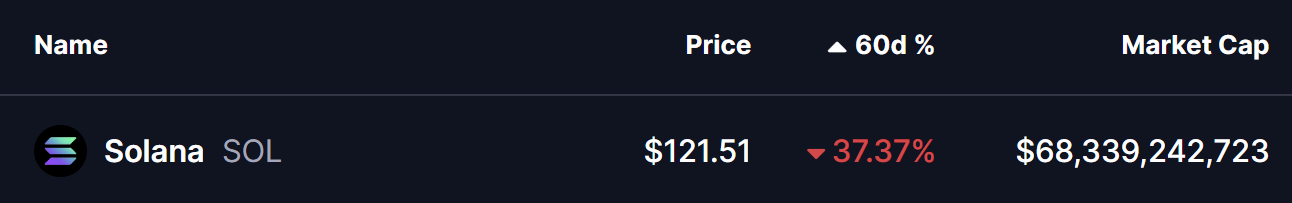
SOL is now down more than 37% over the same period. However, a closer look at the weekly chart suggests that the ongoing weakness may be part of a larger corrective structure rather than the start of a prolonged downtrend. Beneath the surface, the price action is beginning to form a technical setup that could lay the groundwork for a potential bullish reversal if key levels continue to hold.
Bearish Butterfly Pattern Taking Shape
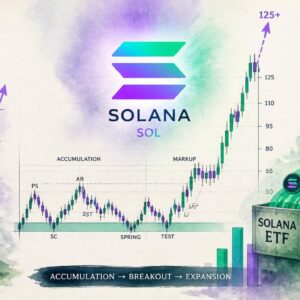
On the weekly timeframe, Solana appears to be developing a Bearish Gartley Butterfly pattern. Despite its name, this harmonic structure often signals exhaustion of the downtrend and sets the stage for an upside reversal once the pattern completes its final leg.
The structure began at Point X near the $295 region, followed by a sharp decline toward Point A. From there, SOL staged a rebound into Point B before rolling over once again. The current decline has pushed price into the $113–$122 zone, an area that aligns with the projected completion region of Point C within the pattern.
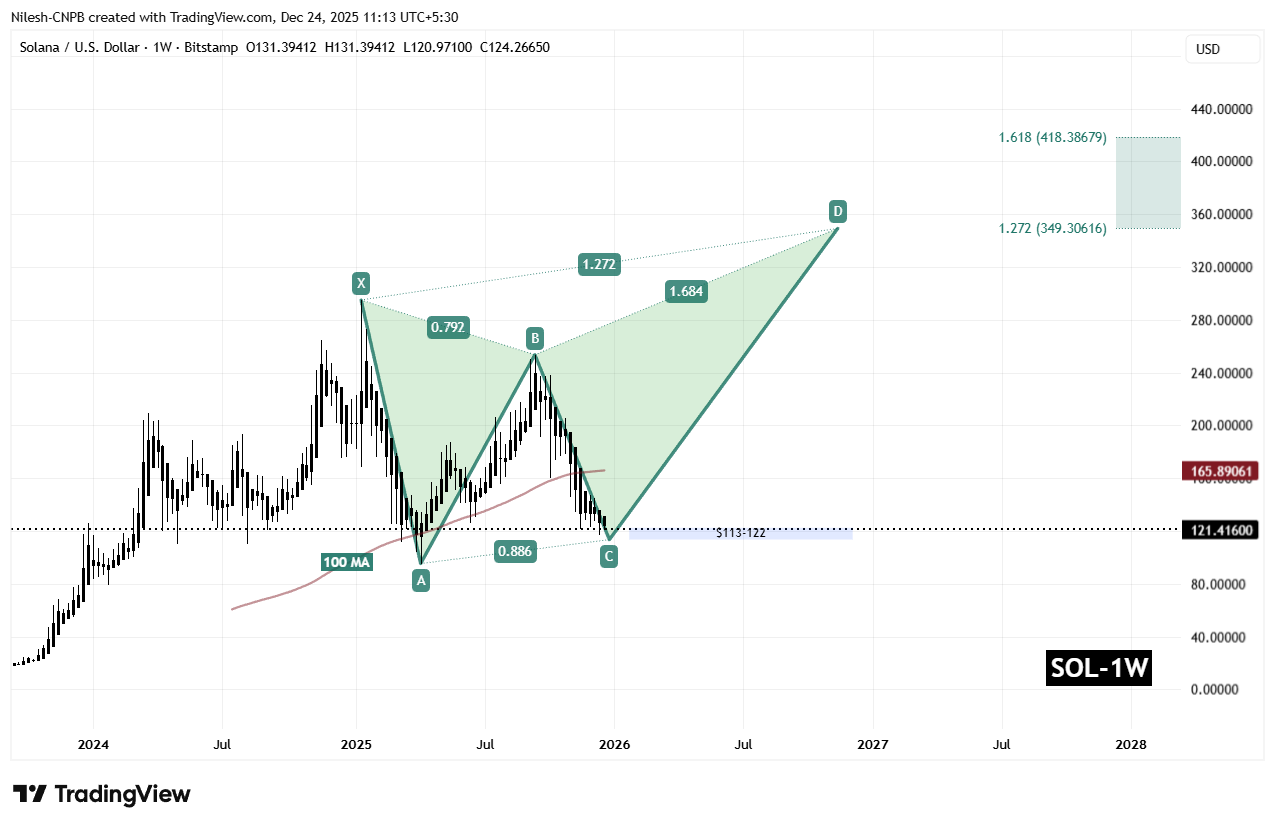
This zone is technically significant, as it represents a confluence of harmonic projections and historical demand. If buyers are able to defend this range, it would increase the probability that Point C is forming, opening the door for the bullish CD leg — the phase that typically drives recovery rallies in harmonic setups.
What’s Next for SOL?
If the $113–$122 support zone holds firm, Solana could begin to stabilize and attempt a reversal toward the 100-period moving average on the weekly chart, currently sitting near $165.89. A successful reclaim of this level would act as early confirmation that bullish momentum is returning.
Beyond that, the harmonic projection points to more ambitious upside targets. A sustained recovery could eventually drive SOL toward the $349.30 to $418.38 region, which aligns with the 1.272 and 1.618 Fibonacci extension levels of the pattern. From current prices, such a move would represent a potential upside of over 240%, assuming broader market conditions turn supportive.
That said, the setup remains conditional. A failure to hold the $113–$122 zone would weaken the bullish thesis, allowing sellers to regain control and potentially push SOL toward new local lows before any meaningful recovery attempt. For now, patience remains critical, and buyers may want to wait for clear confirmation before positioning for a reversal.
Disclaimer: The views and analysis presented in this article are for informational purposes only and reflect the author’s perspective, not financial advice. Technical patterns and indicators discussed are subject to market volatility and may or may not yield the anticipated results. Investors are advised to exercise caution, conduct independent research, and make decisions aligned with their individual risk tolerance.
The opinions and market insights shared on CoinsProbe represent the views of individual authors based on prevailing market conditions at the time of publication. Cryptocurrency investments carry significant risk and volatility. Readers are encouraged to conduct their own research and seek professional financial advice before making investment decisions. CoinsProbe and its contributors do not accept responsibility for financial losses or decisions made based on published content.
CoinsProbe may publish sponsored articles, affiliate links, or promotional collaborations. All sponsored material is clearly labeled to maintain transparency with our audience. Our editorial decisions remain fully independent, and advertising partnerships do not influence reviews, rankings, or published opinions.
Since 2023, CoinsProbe has delivered reliable insights on cryptocurrency, blockchain, and digital assets. Our content is created by experienced researchers and analysts who follow strict editorial standards focused on accuracy, transparency, and credibility. Every article is carefully reviewed and verified using trusted sources and current market data. We provide unbiased analysis and timely updates covering everything from emerging crypto projects to major industry developments.