Date: Mon, Dec 22, 2025 | 10:20 AM GMT
The broader altcoin market has remained stuck in choppy and uncertain price action over the past several weeks. The ongoing correction dragged Ethereum (ETH) lower by more than 22% over the last 60 days, reinforcing a short-term bearish tone across the altcoin space — and Chainlink (LINK) has not been spared.
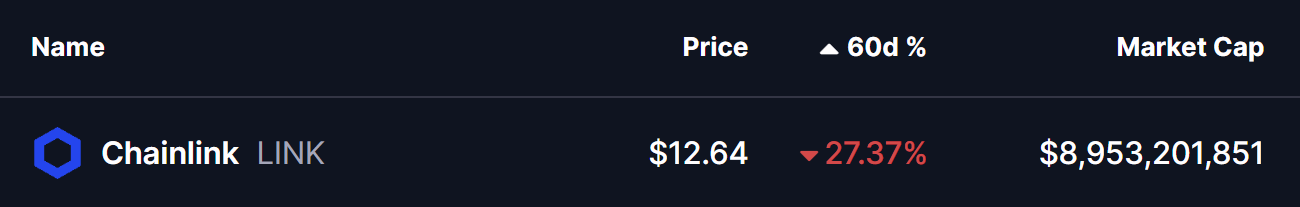
LINK is down over 27% during the same period, reflecting persistent selling pressure and weak sentiment. However, beneath the surface, a combination of rising whale accumulation and a developing technical structure on the daily chart suggests that downside momentum may be slowing, potentially setting the stage for a rebound.
Whale Accumulation Surges Beneath the Sell-Off
Despite LINK’s recent underperformance, large holders appear to be positioning quietly. According to data shared by Lookonchain, over the past three days, 11 newly created wallets have withdrawn approximately 1.567 million LINK — worth nearly $19.8 million — from Binance.
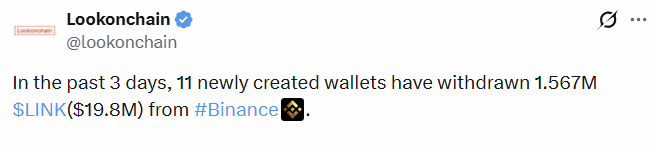
This type of exchange outflow is typically associated with accumulation rather than distribution, as tokens moved off exchanges are less likely to be sold in the near term. While whale activity alone does not guarantee an upside move, it often appears during market phases where smart money begins building longer-term positions amid broader fear and uncertainty.
Harmonic Pattern Hints at Potential Upside
From a technical perspective, LINK’s daily chart is beginning to outline a Bearish Bat harmonic pattern. While the name may sound negative, this structure often produces a strong bullish move during the CD leg before reaching its final completion zone.
The pattern began near Point X around $19.04, followed by a sharp decline to Point A, which marked the initial capitulation move. LINK then rebounded toward Point B, before undergoing a deeper corrective pullback into Point C near $11.73, where buyers stepped in decisively.
Since forming this higher-quality low, LINK has stabilized and rebounded toward the $12.66 region, signaling the early development of the CD leg. This phase is typically where momentum starts to accelerate if the pattern remains valid.
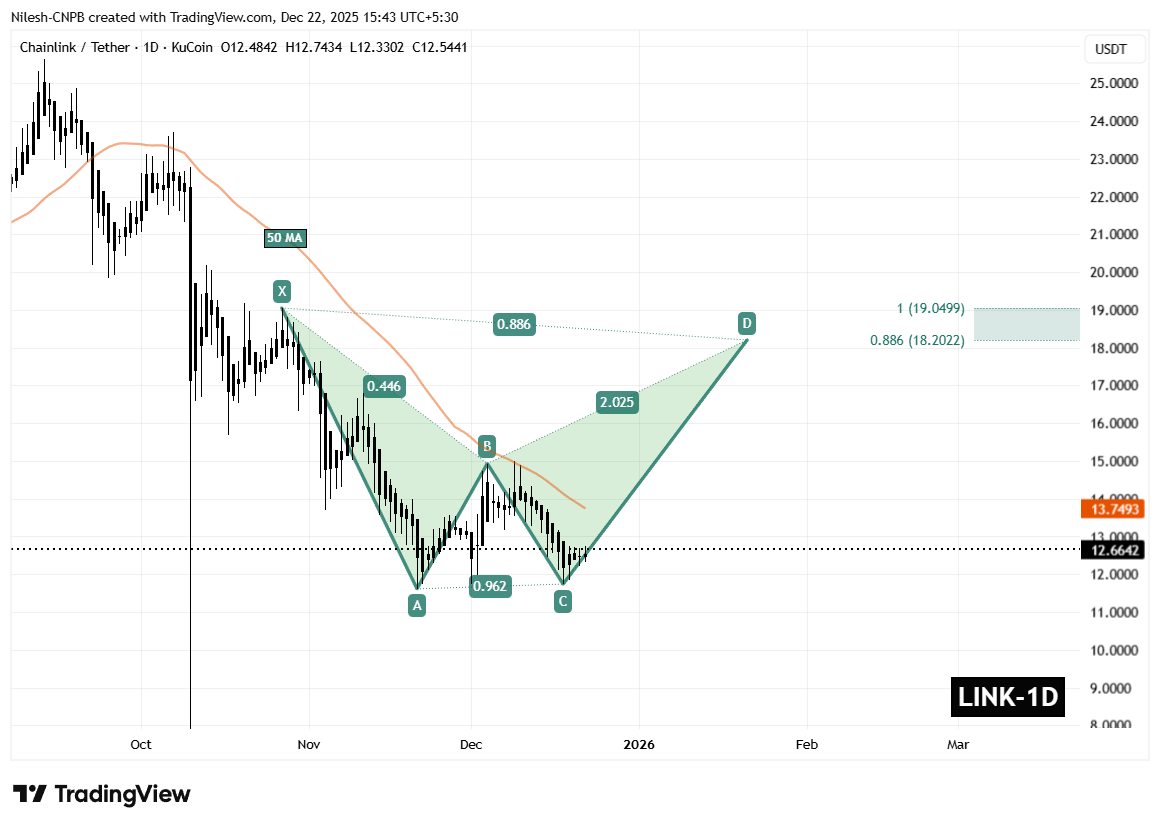
Price is now trading just below the 50-day moving average, currently positioned near $13.74. This level is acting as short-term dynamic resistance, and the chart shows price compressing beneath it. A daily close above the 50 MA would be an important technical confirmation, signaling that buyers are regaining control and that the harmonic expansion is gaining traction.
What’s Next for LINK?
If bulls manage to reclaim and hold above the 50-day MA, the harmonic structure projects a potential upside move toward the Potential Reversal Zone (PRZ) between $18.20 and $19.04. This area aligns closely with the 0.886 and 1.0 Fibonacci extensions, which often act as completion zones for Bearish Bat patterns. Reaching this zone would represent a meaningful recovery from current levels and a clear shift in short-term momentum.
That said, the bullish setup remains conditional. A failure to hold the C-level support near $11.73 would invalidate the harmonic structure and could reopen the door to further consolidation or renewed downside pressure before any sustainable recovery takes place.
For now, LINK sits at an important technical crossroads. With whale accumulation increasing and price stabilizing above a well-defined support base, the coming sessions may prove critical in determining whether this setup evolves into a broader upside move or remains a temporary relief rally.
Disclaimer: The views and analysis presented in this article are for informational purposes only and reflect the author’s perspective, not financial advice. Technical patterns and indicators discussed are subject to market volatility and may or may not yield the anticipated results. Investors are advised to exercise caution, conduct independent research, and make decisions aligned with their individual risk tolerance.
The opinions and market insights shared on CoinsProbe represent the views of individual authors based on prevailing market conditions at the time of publication. Cryptocurrency investments carry significant risk and volatility. Readers are encouraged to conduct their own research and seek professional financial advice before making investment decisions. CoinsProbe and its contributors do not accept responsibility for financial losses or decisions made based on published content.
CoinsProbe may publish sponsored articles, affiliate links, or promotional collaborations. All sponsored material is clearly labeled to maintain transparency with our audience. Our editorial decisions remain fully independent, and advertising partnerships do not influence reviews, rankings, or published opinions.
Since 2023, CoinsProbe has delivered reliable insights on cryptocurrency, blockchain, and digital assets. Our content is created by experienced researchers and analysts who follow strict editorial standards focused on accuracy, transparency, and credibility. Every article is carefully reviewed and verified using trusted sources and current market data. We provide unbiased analysis and timely updates covering everything from emerging crypto projects to major industry developments.