Date: Sun, Dec 21 2025 | 12:15 PM GMT
The broader cryptocurrency market is showing relative strength over the weekend, with both Bitcoin (BTC) and Ethereum (ETH) trading in the green. This stability in the majors has helped lift sentiment across the altcoin space, and Kaspa (KAS) is beginning to respond positively.
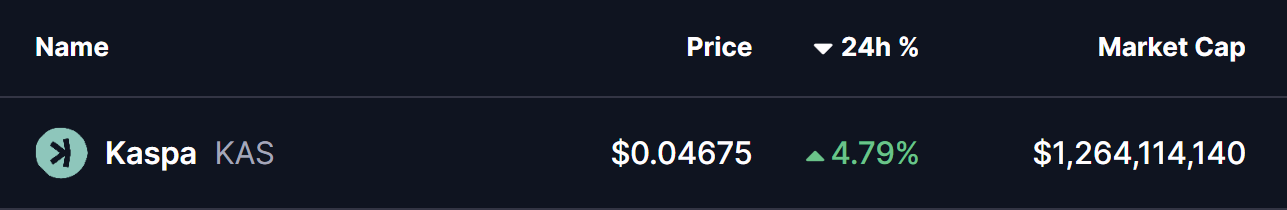
KAS is up more than 4% on the day, and more importantly, its recent price action is starting to outline a clear technical structure. The 4-hour chart suggests that a harmonic pattern is developing, hinting that KAS could be setting up for another upside attempt if key levels are reclaimed.
Harmonic Pattern Taking Shape
On the 4-hour timeframe, KAS appears to be forming a Bearish ABCD harmonic pattern. Despite the bearish label, this setup often delivers a strong bullish CD-leg before price reaches the Potential Reversal Zone (PRZ). This interim rally is typically the most aggressive phase of the structure, and that is the move currently unfolding.
The pattern began with a sharp advance from point A near $0.0360 to point B, marking KAS’s initial impulse higher. This was followed by a corrective pullback into point C around $0.0400, where downside momentum stalled and buyers stepped in decisively. The defense of this level suggests that selling pressure is weakening and that demand is beginning to build.
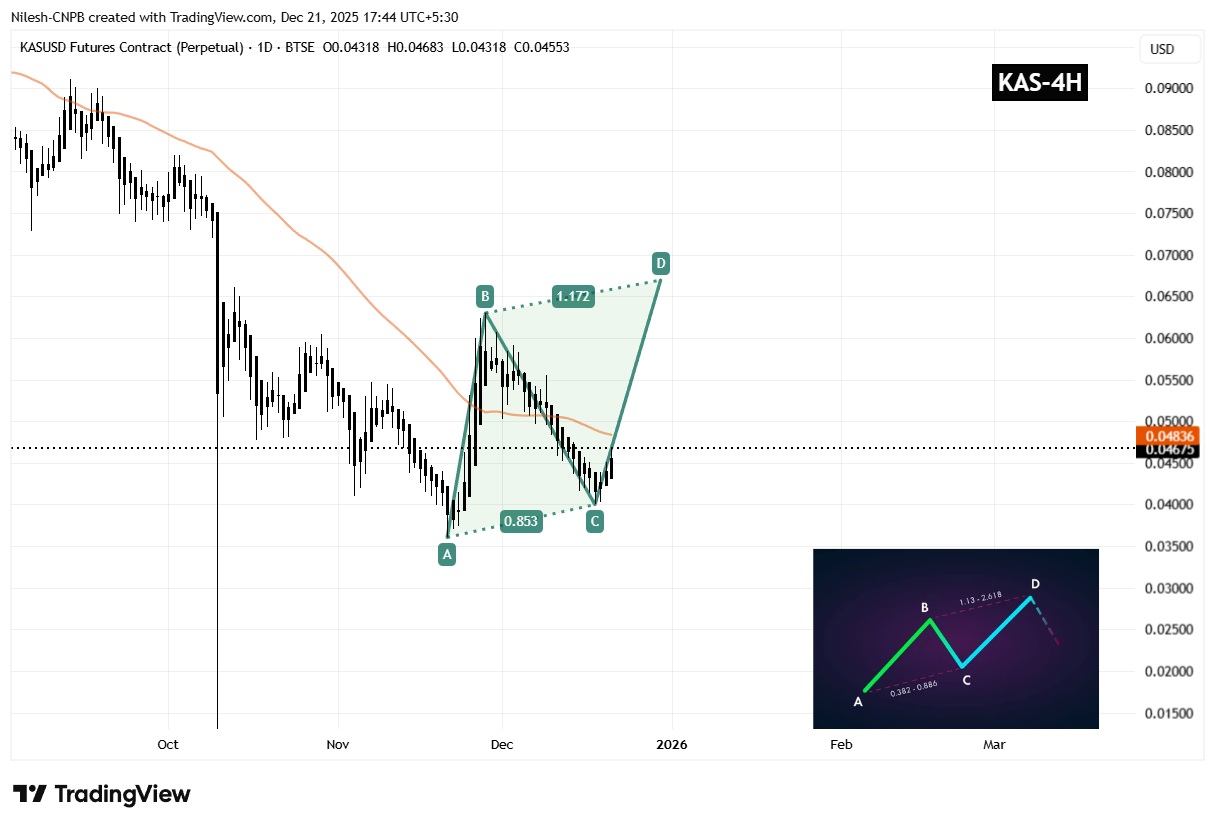
Since bouncing from point C, KAS has pushed back toward the $0.046–$0.047 region, signaling the early stages of the CD-leg. This recovery phase indicates improving short-term momentum as the market tests overhead resistance.
A key technical obstacle now lies at the 50-period moving average, currently near $0.0484. This level has acted as dynamic resistance throughout the recent downtrend, and price is now compressing just below it. A clean breakout and sustained close above the 50 MA would be an important confirmation that bulls are regaining control and that the harmonic structure is progressing as expected.
What’s Next for KAS?
If buyers can drive KAS above the 50 MA and maintain momentum, the next upside objective aligns with the harmonic PRZ near the 1.17 Fibonacci extension around $0.0670. Reaching this zone would complete the ABCD pattern and represent a potential upside of roughly 40%–45% from current levels.
That said, the bullish scenario remains conditional. A failure to break above the 50 MA, followed by a drop back below the C-leg support near $0.0400, would weaken the harmonic setup and reopen the door for renewed bearish pressure.
For now, the structure on the chart suggests KAS is at a technically important inflection point. As long as price continues to hold above recent lows and challenge key resistance levels, the path of least resistance may remain tilted to the upside in the short term.
Disclaimer: The views and analysis presented in this article are for informational purposes only and reflect the author’s perspective, not financial advice. Technical patterns and indicators discussed are subject to market volatility and may or may not yield the anticipated results. Investors are advised to exercise caution, conduct independent research, and make decisions aligned with their individual risk tolerance.
The opinions and market insights shared on CoinsProbe represent the views of individual authors based on prevailing market conditions at the time of publication. Cryptocurrency investments carry significant risk and volatility. Readers are encouraged to conduct their own research and seek professional financial advice before making investment decisions. CoinsProbe and its contributors do not accept responsibility for financial losses or decisions made based on published content.
CoinsProbe may publish sponsored articles, affiliate links, or promotional collaborations. All sponsored material is clearly labeled to maintain transparency with our audience. Our editorial decisions remain fully independent, and advertising partnerships do not influence reviews, rankings, or published opinions.
Since 2023, CoinsProbe has delivered reliable insights on cryptocurrency, blockchain, and digital assets. Our content is created by experienced researchers and analysts who follow strict editorial standards focused on accuracy, transparency, and credibility. Every article is carefully reviewed and verified using trusted sources and current market data. We provide unbiased analysis and timely updates covering everything from emerging crypto projects to major industry developments.