
Date: Sun, Dec 21 2025 | 08:56 AM GMT
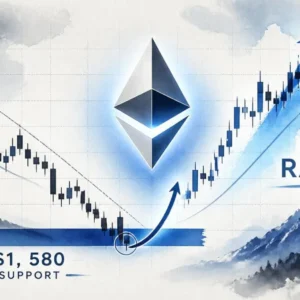
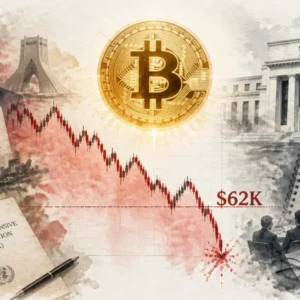
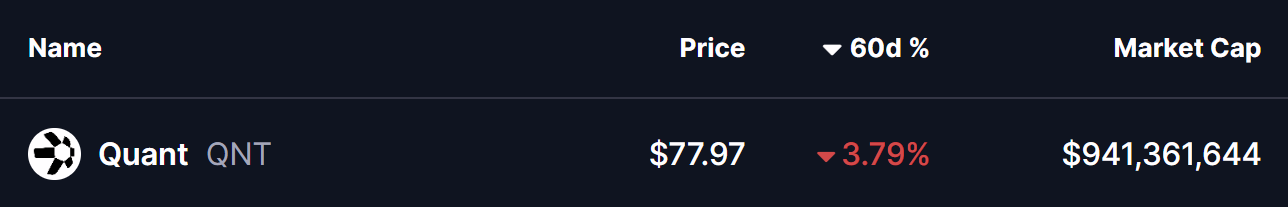
The broader cryptocurrency market has remained under pressure over the past several weeks, following the sharp sell-off that began on October 10. That corrective phase dragged Ethereum (ETH) down by nearly 23% over the last 60 days and weighed heavily on overall market sentiment. While many altcoins have struggled to stabilize, Quant (QNT) has shown relative resilience, posting only a modest decline and holding above a historically important support zone.
From a technical perspective, the daily chart suggests that QNT may be approaching a critical decision point, with price action forming a recognizable structure that could influence its next directional move.
Head and Shoulders Pattern Takes Shape
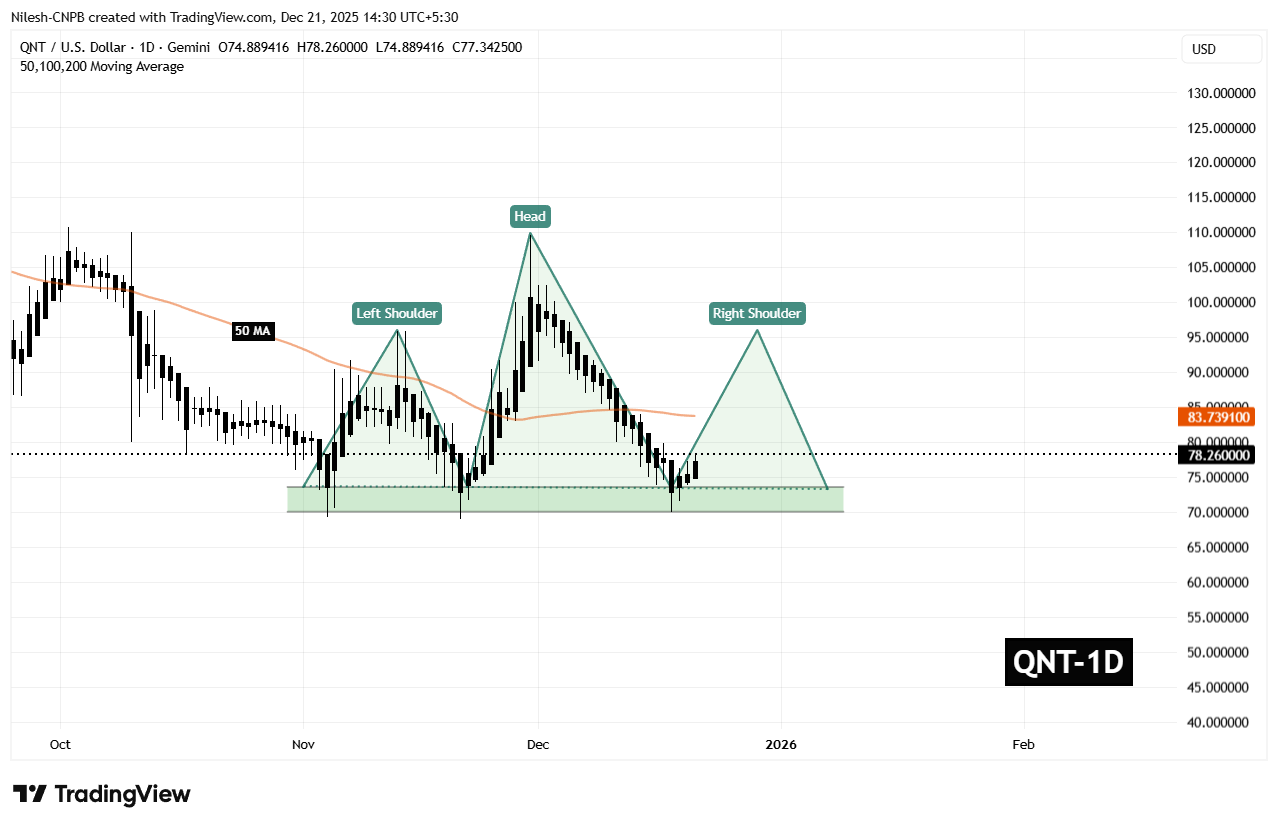
On the daily timeframe, QNT appears to be carving out a head and shoulders formation, a well-known pattern that often signals a potential trend shift once the neckline is tested. Earlier in the structure, QNT formed the left shoulder before rallying sharply to its head near the $100 region. From there, price reversed lower and slid back toward the neckline, located around the $70 support zone.
This $70 area has proven to be a strong demand zone in the past, repeatedly attracting buyers and preventing deeper declines. The recent move into this region was met with a noticeable reaction, as reflected by the long lower wick on the chart. That rejection from support pushed price back toward the $78 level, suggesting that buyers are actively defending the neckline and potentially forming the right shoulder of the pattern.
The behavior around this zone is critical. A successful defense of the neckline often opens the door for a relief rally, especially if broader market conditions stabilize.
What’s Next for QNT?
For bullish momentum to build, QNT needs to reclaim the 50-day moving average, currently sitting near $83.73. This level now acts as a key short-term resistance, and a daily close above it would signal a shift in momentum back in favor of buyers.
If that recovery unfolds, the chart points toward a potential move into the $95.90 region. Such a move would represent a rebound of roughly 22% from current levels and align with the typical reaction seen during the right-shoulder phase of this pattern. A rally of this nature would not only ease recent selling pressure but also place QNT back into a more neutral technical posture.
That said, the setup remains delicate. If the $70 neckline support fails to hold on a sustained basis, the head and shoulders structure would remain bearish, opening the door to further downside and extending the corrective phase. For now, all eyes remain on how price behaves around this key support and whether buyers can regain control above the moving average.
Disclaimer: The views and analysis presented in this article are for informational purposes only and reflect the author’s perspective, not financial advice. Technical patterns and indicators discussed are subject to market volatility and may or may not yield the anticipated results. Investors are advised to exercise caution, conduct independent research, and make decisions aligned with their individual risk tolerance.
The opinions and market insights shared on CoinsProbe represent the views of individual authors based on prevailing market conditions at the time of publication. Cryptocurrency investments carry significant risk and volatility. Readers are encouraged to conduct their own research and seek professional financial advice before making investment decisions. CoinsProbe and its contributors do not accept responsibility for financial losses or decisions made based on published content.
CoinsProbe may publish sponsored articles, affiliate links, or promotional collaborations. All sponsored material is clearly labeled to maintain transparency with our audience. Our editorial decisions remain fully independent, and advertising partnerships do not influence reviews, rankings, or published opinions.
Since 2023, CoinsProbe has delivered reliable insights on cryptocurrency, blockchain, and digital assets. Our content is created by experienced researchers and analysts who follow strict editorial standards focused on accuracy, transparency, and credibility. Every article is carefully reviewed and verified using trusted sources and current market data. We provide unbiased analysis and timely updates covering everything from emerging crypto projects to major industry developments.