
Date: Thu, Dec 18, 2025 | 11:00 AM GMT
The broader cryptocurrency market has been experiencing choppy price action over the past several weeks, a phase that began after the sharp sell-off on October 10. That correction dragged Ethereum (ETH) down by nearly 27% over the last 60 days, keeping sustained pressure on major altcoins, including DEX token Aster ($ASTER).
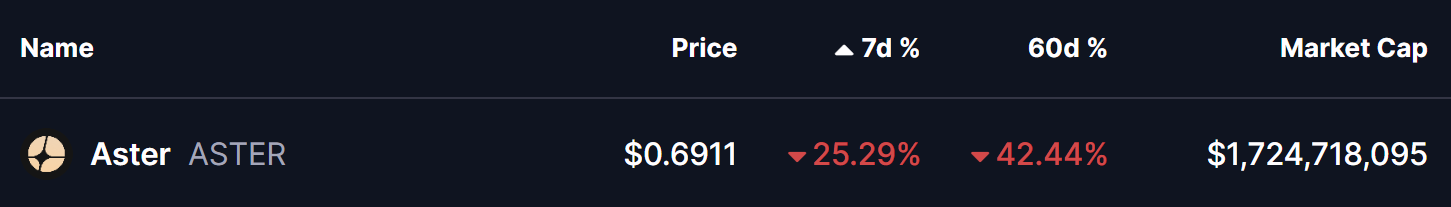
ASTER has fallen more than 25% over a week alone, extending its 60-day decline to roughly 42%. While the short-term trend remains firmly bearish, a closer look at the chart suggests something more constructive may be developing beneath the surface.
Interestingly, ASTER’s current structure is beginning to resemble the bottoming pattern previously seen in Hyperliquid (HYPE), a setup that ultimately led to a powerful trend reversal earlier this year.
ASTER Mirrors HYPE’s Bottoming Path
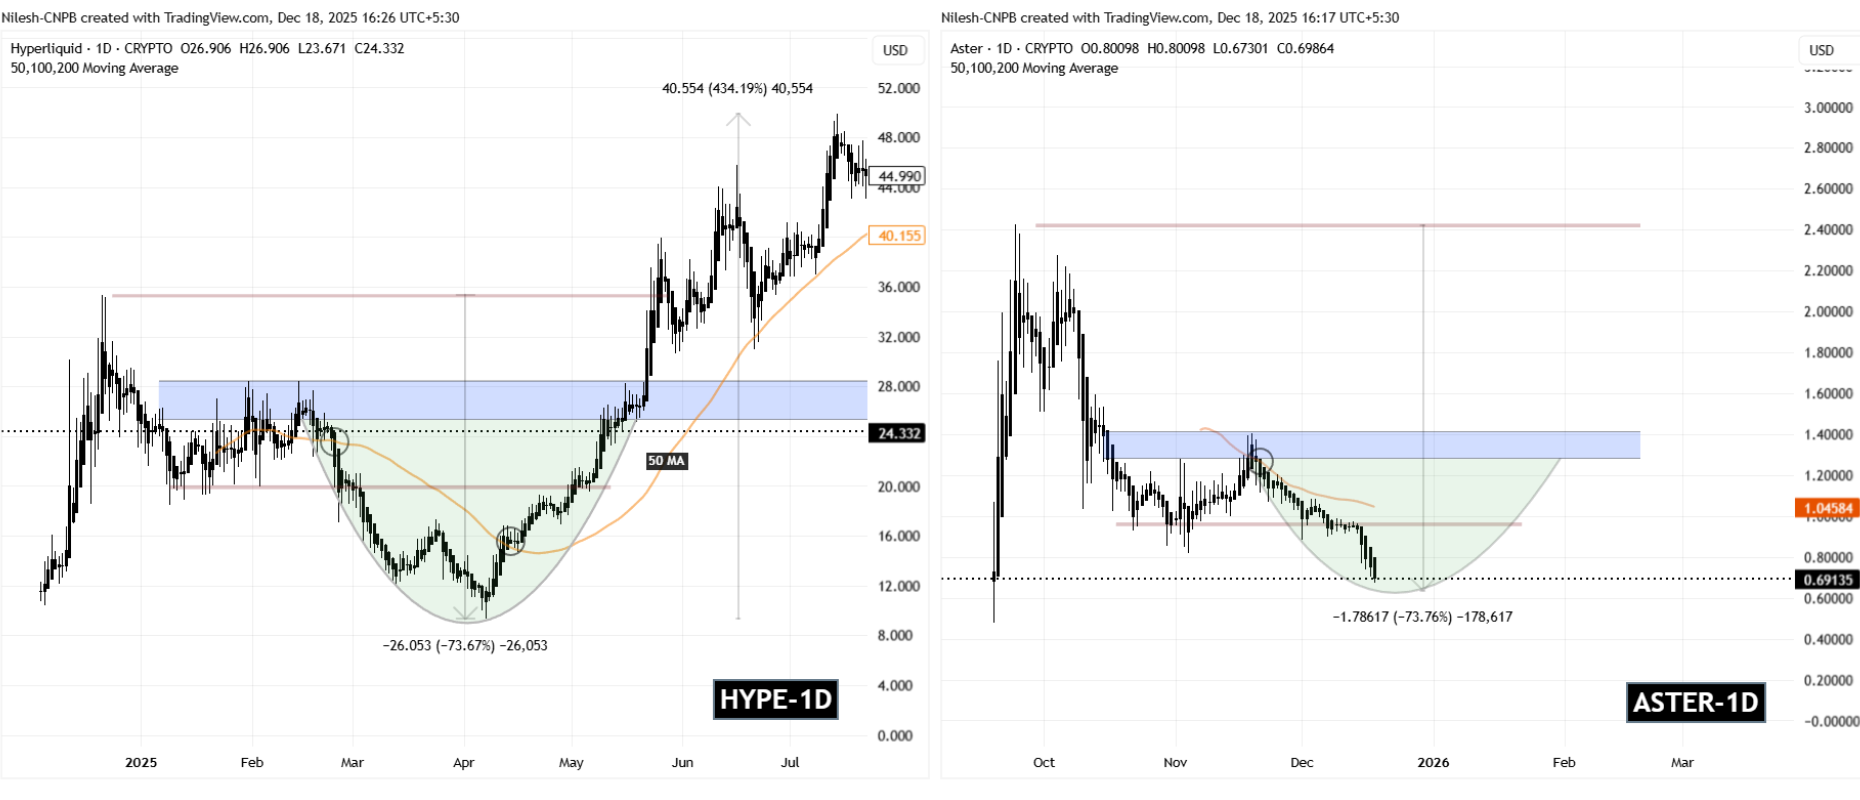
Aster appears to be tracing a price structure that closely aligns with HYPE’s April 2025 fractal — a period that preceded a multi-hundred-percent rally.
HYPE’s move began with a sharp correction following its all-time high. That decline eventually forced price below the 50-day moving average, confirming a shift in momentum. Rather than collapsing further in a straight line, HYPE transitioned into a rounding bottom structure, reflecting a gradual slowdown in selling pressure and the early stages of accumulation.
The token ultimately found its floor after a steep 73% drawdown from its peak, a point that marked clear seller exhaustion. From there, momentum shifted decisively. A clean reclaim of the 50-day moving average acted as the key confirmation signal, setting the stage for a breakout from the rounding bottom. What followed was a powerful 434% rally, making it one of HYPE’s most notable reversals of the year.
Now, ASTER appears to be walking a similar road.
After topping out near its all-time high around $2.42, ASTER entered a prolonged corrective phase and slipped below its 50-day moving average. The chart now shows price carving out a potential rounding bottom, with the $1.30–$1.40 region acting as a key neckline zone. This structure closely mirrors HYPE’s pre-bottom behavior, as highlighted in the comparative chart.
What’s Next for ASTER?
If this fractal continues to unfold, ASTER may still face some near-term downside pressure. A deeper move toward the $0.60 area would complete a decline of roughly 73% from its all-time high — the same magnitude of correction where HYPE previously established its bottom.
From a bullish standpoint, the first meaningful signal to watch is a reclaim of the 50-day moving average, currently hovering near the $1.04 level. A sustained move above this zone would suggest that bearish momentum is weakening. If followed by a decisive breakout above the neckline resistance, ASTER could transition into a broader recovery phase, potentially echoing the type of upside expansion HYPE experienced after confirming its reversal.
Key Risk Note
While fractal similarities can offer valuable context, they do not guarantee identical outcomes. Market conditions, liquidity dynamics, and broader sentiment can differ significantly from one asset to another. Confirmation remains critical, and downside invalidation levels should be respected if the structure fails to hold.
For now, ASTER appears to be approaching a critical inflection point. Whether this evolving structure turns into a confirmed bottom or merely a pause before further weakness will depend on how price behaves around its moving averages and key support zones in the days ahead.
Disclaimer: The views and analysis presented in this article are for informational purposes only and reflect the author’s perspective, not financial advice. Technical patterns and indicators discussed are subject to market volatility and may or may not yield the anticipated results. Investors are advised to exercise caution, conduct independent research, and make decisions aligned with their individual risk tolerance.
The opinions and market insights shared on CoinsProbe represent the views of individual authors based on prevailing market conditions at the time of publication. Cryptocurrency investments carry significant risk and volatility. Readers are encouraged to conduct their own research and seek professional financial advice before making investment decisions. CoinsProbe and its contributors do not accept responsibility for financial losses or decisions made based on published content.
CoinsProbe may publish sponsored articles, affiliate links, or promotional collaborations. All sponsored material is clearly labeled to maintain transparency with our audience. Our editorial decisions remain fully independent, and advertising partnerships do not influence reviews, rankings, or published opinions.
Since 2023, CoinsProbe has delivered reliable insights on cryptocurrency, blockchain, and digital assets. Our content is created by experienced researchers and analysts who follow strict editorial standards focused on accuracy, transparency, and credibility. Every article is carefully reviewed and verified using trusted sources and current market data. We provide unbiased analysis and timely updates covering everything from emerging crypto projects to major industry developments.