Date: Wed, Nov 12, 2025 | 12:20 PM GMT
The cryptocurrency market is showing signs of a rebound in the last few hours as Ethereum (ETH) climbed from its 24-hour low of $3,404 to around $3,533. This short-term recovery has lifted overall market sentiment, pushing several altcoins into the green — including Aster (ASTER).
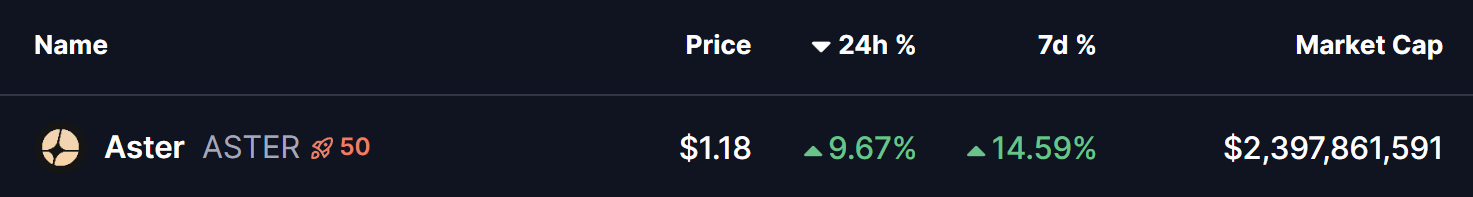
ASTER has surged by nearly 9% today, extending its weekly gains to around 14%. More importantly, the latest price structure indicates that the token may be preparing for a stronger move ahead.
Ascending Triangle Breakout
On the 4-hour chart, ASTER had been consolidating within an ascending triangle pattern, showing a steady formation of higher lows while repeatedly facing rejection near the $1.17 resistance level.
Today, bulls managed to push ASTER beyond this crucial resistance, confirming a breakout that sent prices toward a local high of $1.1923. This breakout highlights the growing bullish strength and signals that momentum has shifted clearly in favor of buyers.
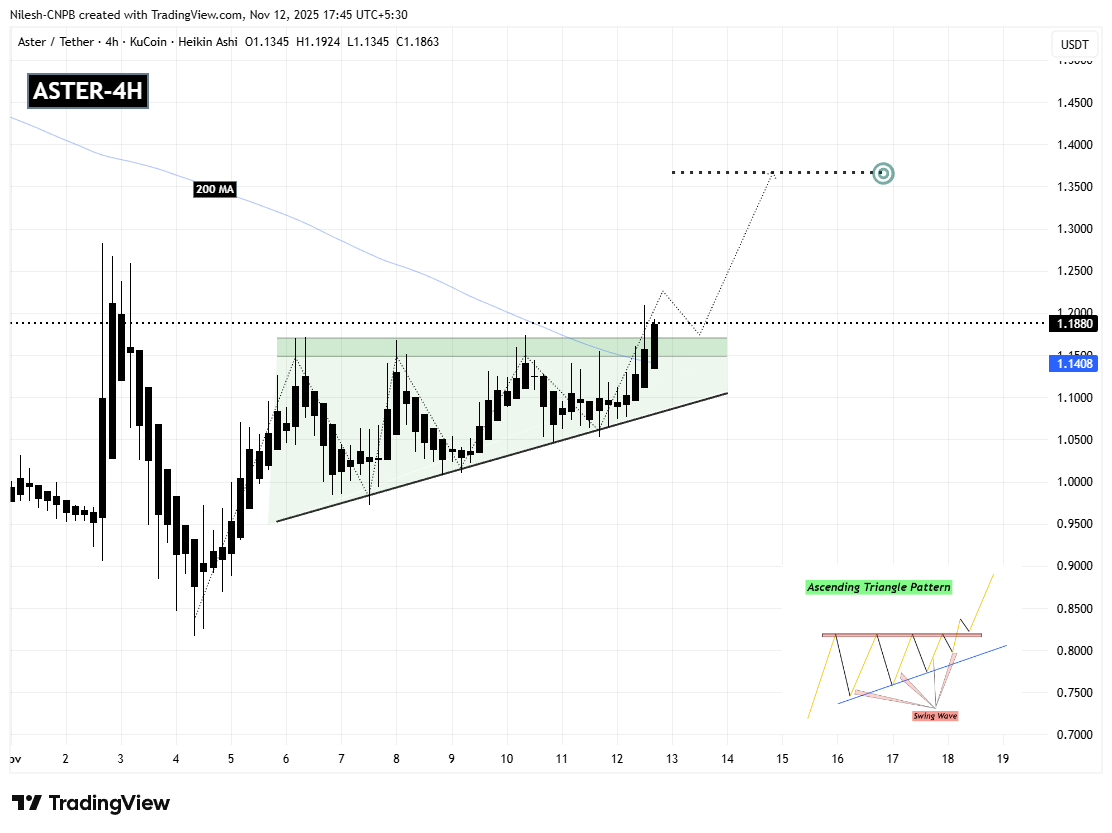
Additionally, ASTER has reclaimed the 200 moving average (200 MA) near $1.1408, a key dynamic level that could act as fresh support if the price retests this region in the short term.
What’s Next for ASTER?
From the current momentum, ASTER may revisit the $1.17–$1.14 zone to retest its breakout structure and confirm it as new support. A successful retest could open the door for an upside continuation toward $1.36, marking a potential 14% gain from current prices.
However, if ASTER fails to hold above its breakout zone or slips back below the moving averages, the bullish outlook could weaken — potentially leading to a deeper correction before any renewed upside attempt.
Disclaimer: The views and analysis presented in this article are for informational purposes only and reflect the author’s perspective, not financial advice. Technical patterns and indicators discussed are subject to market volatility and may or may not yield the anticipated results. Investors are advised to exercise caution, conduct independent research, and make decisions aligned with their individual risk tolerance.
The opinions and market insights shared on CoinsProbe represent the views of individual authors based on prevailing market conditions at the time of publication. Cryptocurrency investments carry significant risk and volatility. Readers are encouraged to conduct their own research and seek professional financial advice before making investment decisions. CoinsProbe and its contributors do not accept responsibility for financial losses or decisions made based on published content.
CoinsProbe may publish sponsored articles, affiliate links, or promotional collaborations. All sponsored material is clearly labeled to maintain transparency with our audience. Our editorial decisions remain fully independent, and advertising partnerships do not influence reviews, rankings, or published opinions.
Since 2023, CoinsProbe has delivered reliable insights on cryptocurrency, blockchain, and digital assets. Our content is created by experienced researchers and analysts who follow strict editorial standards focused on accuracy, transparency, and credibility. Every article is carefully reviewed and verified using trusted sources and current market data. We provide unbiased analysis and timely updates covering everything from emerging crypto projects to major industry developments.