
Date: Sun, Oct 26, 2025 | 10:01 AM GMT
The broader cryptocurrency market continues to show a steady upside tone today, with both Bitcoin (BTC) and Ethereum (ETH) posting modest gains. This broader recovery is creating room for strength across several altcoins — including the Layer-1 token Sui (SUI), which is now flashing a key technical signal hinting at a potential bullish move.
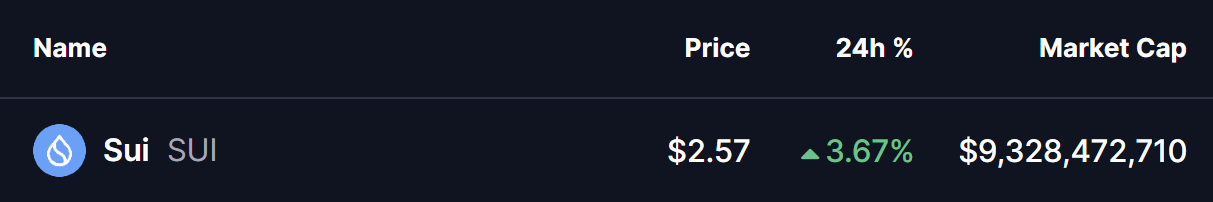
SUI is trading higher by 3% today, and more importantly, its chart is displaying a harmonic pattern formation that could pave the way for further upward momentum in the short term.
Harmonic Pattern Hints at Potential Upside
On the 4-hour chart, SUI appears to have formed a Bearish Bat harmonic pattern — a setup that, despite its bearish label, typically includes a bullish rally in the CD leg before reaching the Potential Reversal Zone (PRZ).
The structure started from Point X ($3.016), dropped to Point A, rebounded into Point B, and retraced to Point C near $2.341. From that zone, SUI has shown strong recovery momentum and is now trading near $2.5721, having reclaimed its 50-hour moving average ($2.5101) — a sign that buyers are gaining back control and the bullish sentiment is returning.
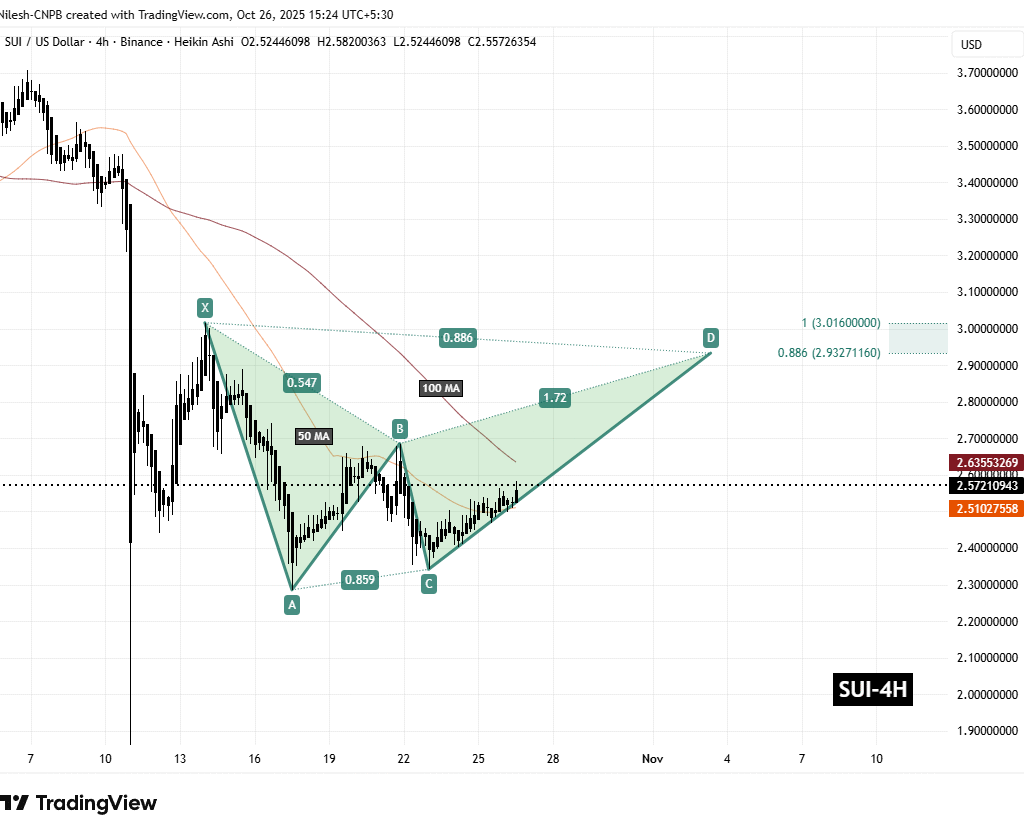
The next key test lies at the 100-hour moving average ($2.6355). A breakout and close above this level would confirm the continuation of the bullish CD leg, potentially accelerating the upward move toward the PRZ zone.
What’s Next for SUI?
If the bullish momentum continues and SUI holds above the 50-hour MA, a sustained breakout above the 100-hour MA could push prices toward the target zone between $2.93 (0.886 Fibonacci extension) and $3.01 (1.618 extension). This range marks the completion area of the Bearish Bat harmonic pattern, which often acts as a strong resistance zone where short-term traders may consider booking profits.
However, if SUI fails to hold support near the 50-hour MA, it could trigger a short-term pullback or consolidation phase, giving bulls time to regroup before another possible upward push.
For now, SUI’s chart structure remains constructive, and as long as it maintains higher lows and reclaims key moving averages, the probability of further upside remains strong.
Disclaimer: The views and analysis presented in this article are for informational purposes only and reflect the author’s perspective, not financial advice. Technical patterns and indicators discussed are subject to market volatility and may or may not yield the anticipated results. Investors are advised to exercise caution, conduct independent research, and make decisions aligned with their individual risk tolerance.
The opinions and market insights shared on CoinsProbe represent the views of individual authors based on prevailing market conditions at the time of publication. Cryptocurrency investments carry significant risk and volatility. Readers are encouraged to conduct their own research and seek professional financial advice before making investment decisions. CoinsProbe and its contributors do not accept responsibility for financial losses or decisions made based on published content.
CoinsProbe may publish sponsored articles, affiliate links, or promotional collaborations. All sponsored material is clearly labeled to maintain transparency with our audience. Our editorial decisions remain fully independent, and advertising partnerships do not influence reviews, rankings, or published opinions.
Since 2023, CoinsProbe has delivered reliable insights on cryptocurrency, blockchain, and digital assets. Our content is created by experienced researchers and analysts who follow strict editorial standards focused on accuracy, transparency, and credibility. Every article is carefully reviewed and verified using trusted sources and current market data. We provide unbiased analysis and timely updates covering everything from emerging crypto projects to major industry developments.