
Date: Mon, Oct 20, 2025 | 05:54 AM GMT
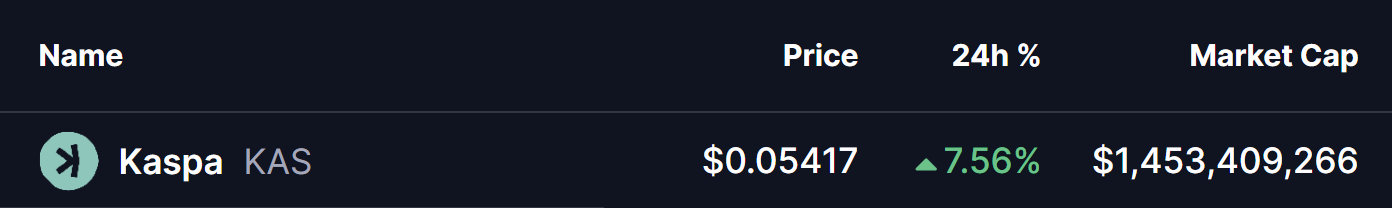
The cryptocurrency market is off to a strong start this week after a period of choppy momentum last week. Both Bitcoin (BTC) and Ethereum (ETH) are trading in the green, posting impressive gains of over 3% and 4%, respectively — lifting sentiment across the broader altcoin market, including Kaspa (KAS).
KAS has surged by more than 7% today, and its chart is revealing a notable bullish pattern that hints at a potential continuation of this upward momentum.
Bump-and-Run Reversal (BARR) Pattern in Play
On the 1-hour chart, Kaspa’s price action appears to be forming a Bump-and-Run Reversal (BARR) pattern — a rare yet highly reliable technical setup that often marks the transition from a bearish phase to a bullish trend.
The Lead-in Phase started when KAS faced rejection from its descending trendline near the $0.06551 zone, pushing prices lower to form the Bump Phase bottom around $0.048.
Following this low, KAS rebounded strongly, breaking above the trendline resistance before pulling back for a throwback retest — a healthy technical sign that often precedes the start of a sustained rally.
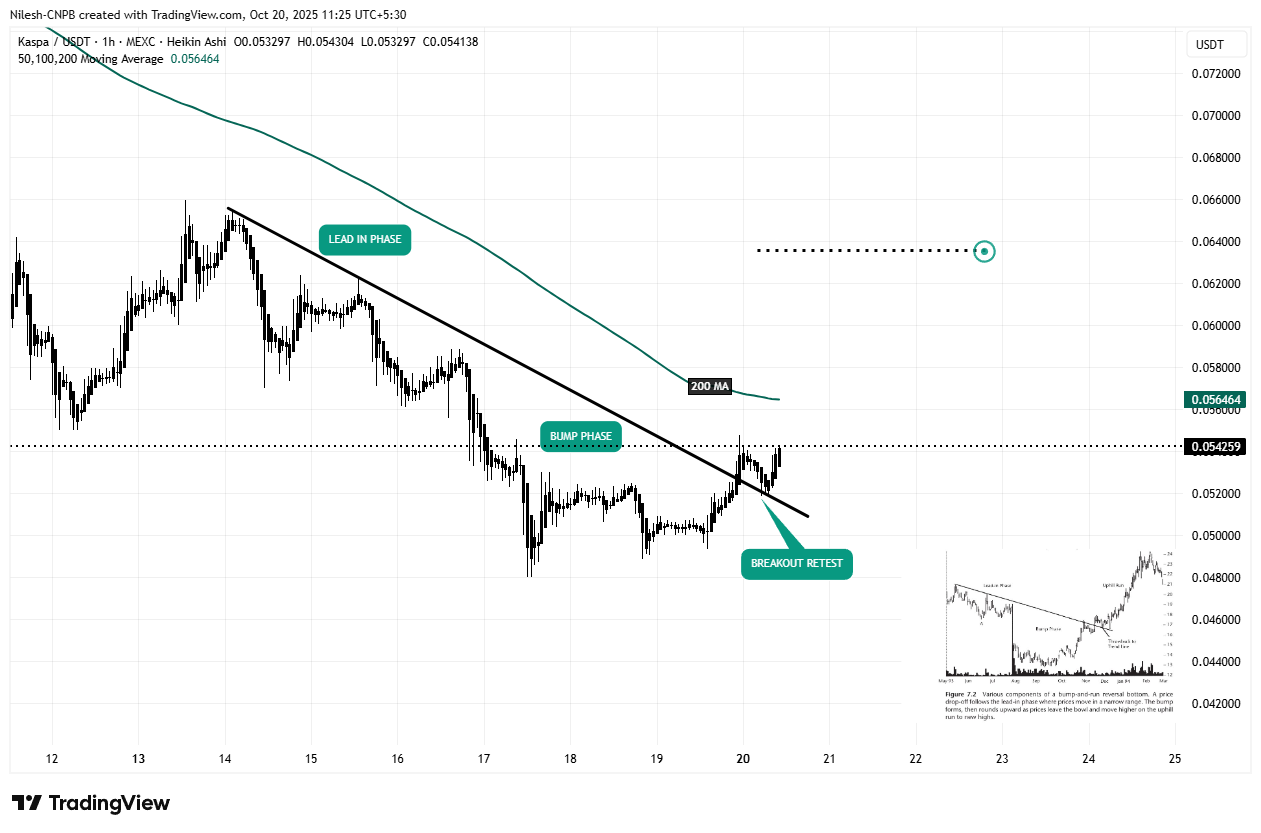
At press time, KAS is trading around $0.054, hovering just below its 200-hour moving average (MA) at $0.05646. This moving average has now become a key decision point; a decisive close above it could confirm the bullish breakout and signal the beginning of the Uphill Run Phase in the BARR pattern.
What’s Next for KAS?
If this pattern continues to unfold as expected, a successful reclaim of the 200-hour MA could fuel a strong move higher, with the next target sitting near $0.06359 — representing a potential 17% upside from current levels.
However, if KAS fails to break above the moving average, a short-term pullback or sideways consolidation could follow before the next leg up. Still, as long as the broader structure remains intact and the price holds above the $0.050 support region, the overall bias remains bullish.
For now, Kaspa’s technical setup looks promising, and traders are closely watching to see if this reversal structure can confirm into a sustained rally in the coming sessions.
Disclaimer: The views and analysis presented in this article are for informational purposes only and reflect the author’s perspective, not financial advice. Technical patterns and indicators discussed are subject to market volatility and may or may not yield the anticipated results. Investors are advised to exercise caution, conduct independent research, and make decisions aligned with their individual risk tolerance.
The opinions and market insights shared on CoinsProbe represent the views of individual authors based on prevailing market conditions at the time of publication. Cryptocurrency investments carry significant risk and volatility. Readers are encouraged to conduct their own research and seek professional financial advice before making investment decisions. CoinsProbe and its contributors do not accept responsibility for financial losses or decisions made based on published content.
CoinsProbe may publish sponsored articles, affiliate links, or promotional collaborations. All sponsored material is clearly labeled to maintain transparency with our audience. Our editorial decisions remain fully independent, and advertising partnerships do not influence reviews, rankings, or published opinions.
Since 2023, CoinsProbe has delivered reliable insights on cryptocurrency, blockchain, and digital assets. Our content is created by experienced researchers and analysts who follow strict editorial standards focused on accuracy, transparency, and credibility. Every article is carefully reviewed and verified using trusted sources and current market data. We provide unbiased analysis and timely updates covering everything from emerging crypto projects to major industry developments.