
Date: Thu, Aug 28, 2025 | 05:30 AM GMT
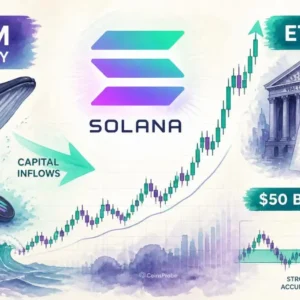
The cryptocurrency market is staging a notable comeback from recent volatility. Ethereum (ETH) briefly dipped to $4,320 before rebounding to around $4,575, lifting sentiment across the major altcoins, including Solana (SOL).
Today, SOL flipped green, and its latest chart structure suggests that more upside may be on the way.
Harmonic Pattern Hints at Potential Bounce
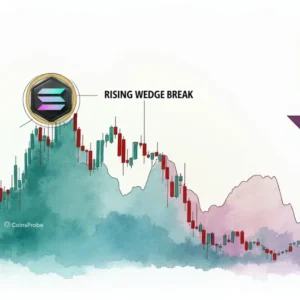
On the daily chart, SOL is currently developing a Bearish ABCD harmonic pattern. Despite the bearish classification, these setups often produce a bullish CD-leg continuation before the market reaches its final Potential Reversal Zone (PRZ).
The move began with a strong rally from Point A near $126.76 to Point B around $213, followed by a healthy retracement into Point C at $155.82, where buyers aggressively re-entered. Since then, SOL has bounced back sharply and is now trading at approximately $211, indicating that the CD-leg extension is in full swing.
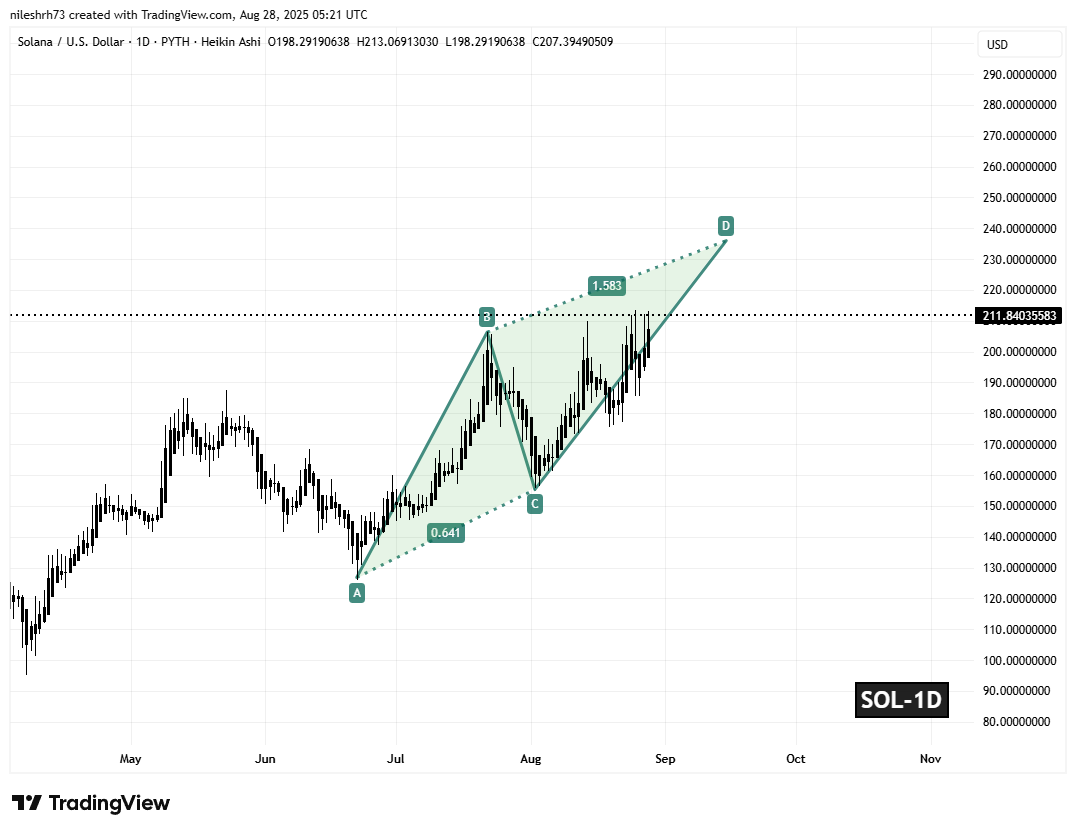
If the pattern unfolds according to the traditional ABCD framework, the CD-leg could stretch toward the 1.58 Fibonacci projection of the BC leg, which places the PRZ near $236.01 — about +10% higher from current levels.
What’s Next for SOL?
If bullish momentum continues, SOL could climb toward the $236.01 resistance zone. This area is expected to act as a significant profit-taking and potential reversal level, so traders should be prepared for possible short-term pullbacks upon arrival.
Overall, the harmonic setup points to further upside potential in the short term, with $236.01 standing as the next key target for traders to watch.

Disclaimer: This article is for informational purposes only and not financial advice. Always conduct your own research before investing in cryptocurrencies.
The opinions and market insights shared on CoinsProbe represent the views of individual authors based on prevailing market conditions at the time of publication. Cryptocurrency investments carry significant risk and volatility. Readers are encouraged to conduct their own research and seek professional financial advice before making investment decisions. CoinsProbe and its contributors do not accept responsibility for financial losses or decisions made based on published content.
CoinsProbe may publish sponsored articles, affiliate links, or promotional collaborations. All sponsored material is clearly labeled to maintain transparency with our audience. Our editorial decisions remain fully independent, and advertising partnerships do not influence reviews, rankings, or published opinions.
Since 2023, CoinsProbe has delivered reliable insights on cryptocurrency, blockchain, and digital assets. Our content is created by experienced researchers and analysts who follow strict editorial standards focused on accuracy, transparency, and credibility. Every article is carefully reviewed and verified using trusted sources and current market data. We provide unbiased analysis and timely updates covering everything from emerging crypto projects to major industry developments.