
Date: Sat, Aug 23, 2025 | 07:04 PM GMT
The cryptocurrency market turned bullish after Jerome Powell hinted at potential rate cuts in September during today’s Jackson Hole event. Following the remarks, Ethereum (ETH) surged to a new all-time high of $4,878, igniting strong momentum across the altcoin sector, including Artificial Superintelligence Alliance (FET).
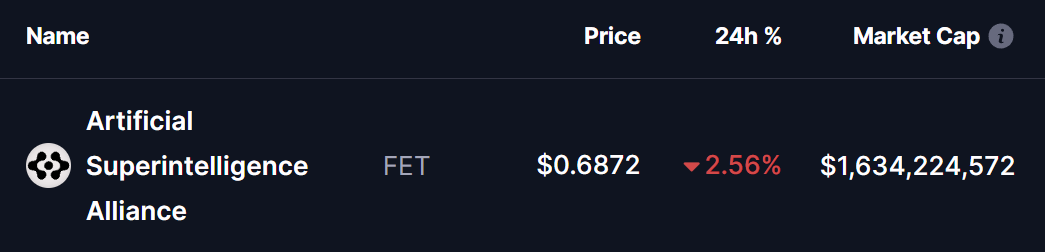
FET is trading in the red, but its latest chart structure suggests that the upside move could be on the horizon.
Harmonic Pattern Hints at Bullish Continuation
On the daily chart, FET is forming a Bearish Gartley harmonic pattern. Despite the “bearish” label, this formation often precedes strong rallies during the CD leg — typically the most impulsive stage of the move.
- The structure began at point X ($0.8853),
- Dropped to point A, before rebounding to point B,
- Then retraced lower to point C around $0.6382.
From there, FET has bounced back sharply and is now trading near $0.68, reclaiming the 200-day moving average ($0.6747)—a crucial sign of regained bullish momentum.
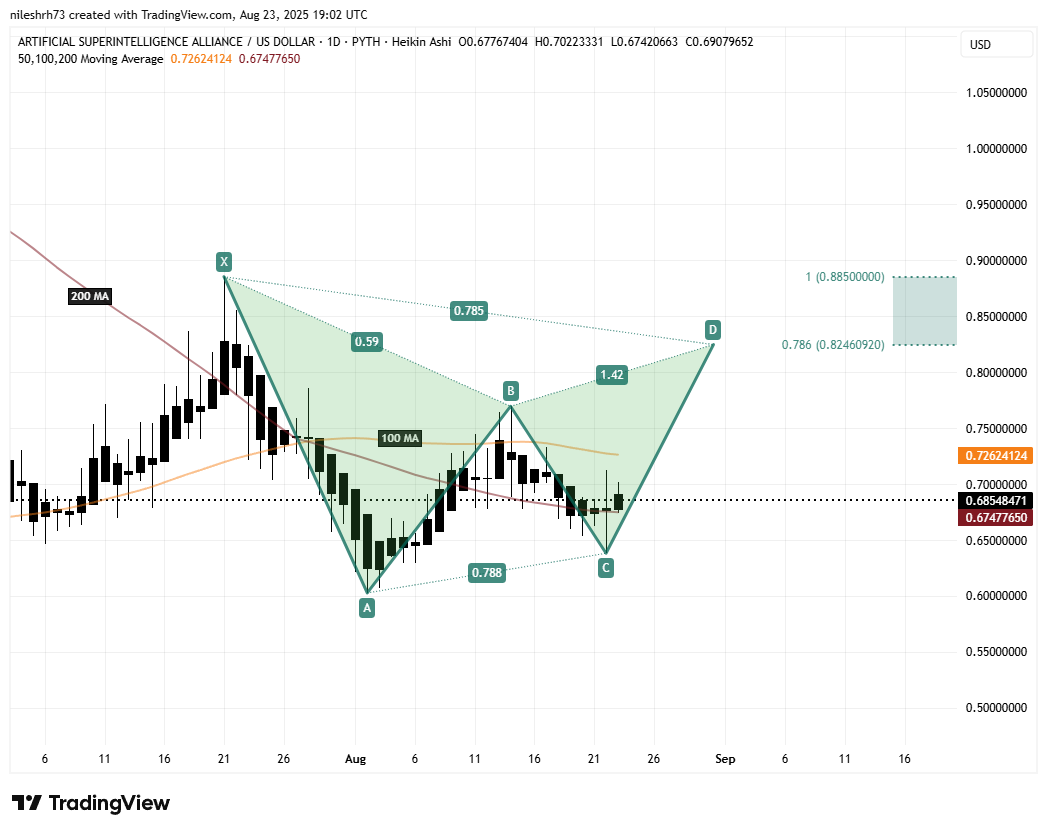
The immediate challenge for bulls lies at the 100-day moving average ($0.7262), which has acted as a strong resistance barrier in recent months. A decisive close above this level could open the doors for the next leg higher.
What’s Next for FET?
If buyers manage to push FET above the 100-day MA, the token could rally toward its Potential Reversal Zone (PRZ) between $0.8246 and $0.8850. These Fibonacci-based targets represent where the Gartley pattern is likely to complete before a potential pullback. From current levels, this move would represent up to a 29% upside.
On the flip side, the 200-day MA ($0.6747) now acts as the most important support. As long as FET holds above this level, the bullish outlook remains valid. A breakdown below it, however, would weaken the setup and delay the upside scenario.
Disclaimer: This article is for informational purposes only and not financial advice. Always conduct your own research before investing in cryptocurrencies.
The opinions and market insights shared on CoinsProbe represent the views of individual authors based on prevailing market conditions at the time of publication. Cryptocurrency investments carry significant risk and volatility. Readers are encouraged to conduct their own research and seek professional financial advice before making investment decisions. CoinsProbe and its contributors do not accept responsibility for financial losses or decisions made based on published content.
CoinsProbe may publish sponsored articles, affiliate links, or promotional collaborations. All sponsored material is clearly labeled to maintain transparency with our audience. Our editorial decisions remain fully independent, and advertising partnerships do not influence reviews, rankings, or published opinions.
Since 2023, CoinsProbe has delivered reliable insights on cryptocurrency, blockchain, and digital assets. Our content is created by experienced researchers and analysts who follow strict editorial standards focused on accuracy, transparency, and credibility. Every article is carefully reviewed and verified using trusted sources and current market data. We provide unbiased analysis and timely updates covering everything from emerging crypto projects to major industry developments.