
Date: Fri, Aug 22, 2025 | 09:56 AM GMT
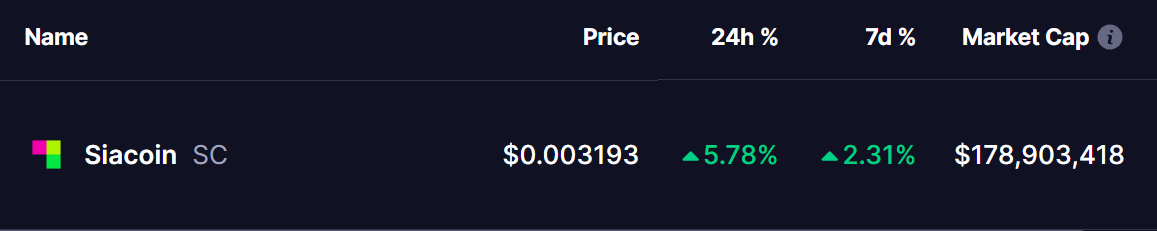
The cryptocurrency market is facing notable pullback as Ethereum (ETH) pulls back to $4,300 from its recent $4,780 peak, marking a 7% weekly decline. While the correction has weighed on most altcoins, Siacoin (SC) is quietly showing signs of resilience, gaining 5% today.
More importantly, its chart is flashing a familiar fractal pattern — one that historically preceded a bullish rally.
Fractal Setup Hints at a Bullish Continuation
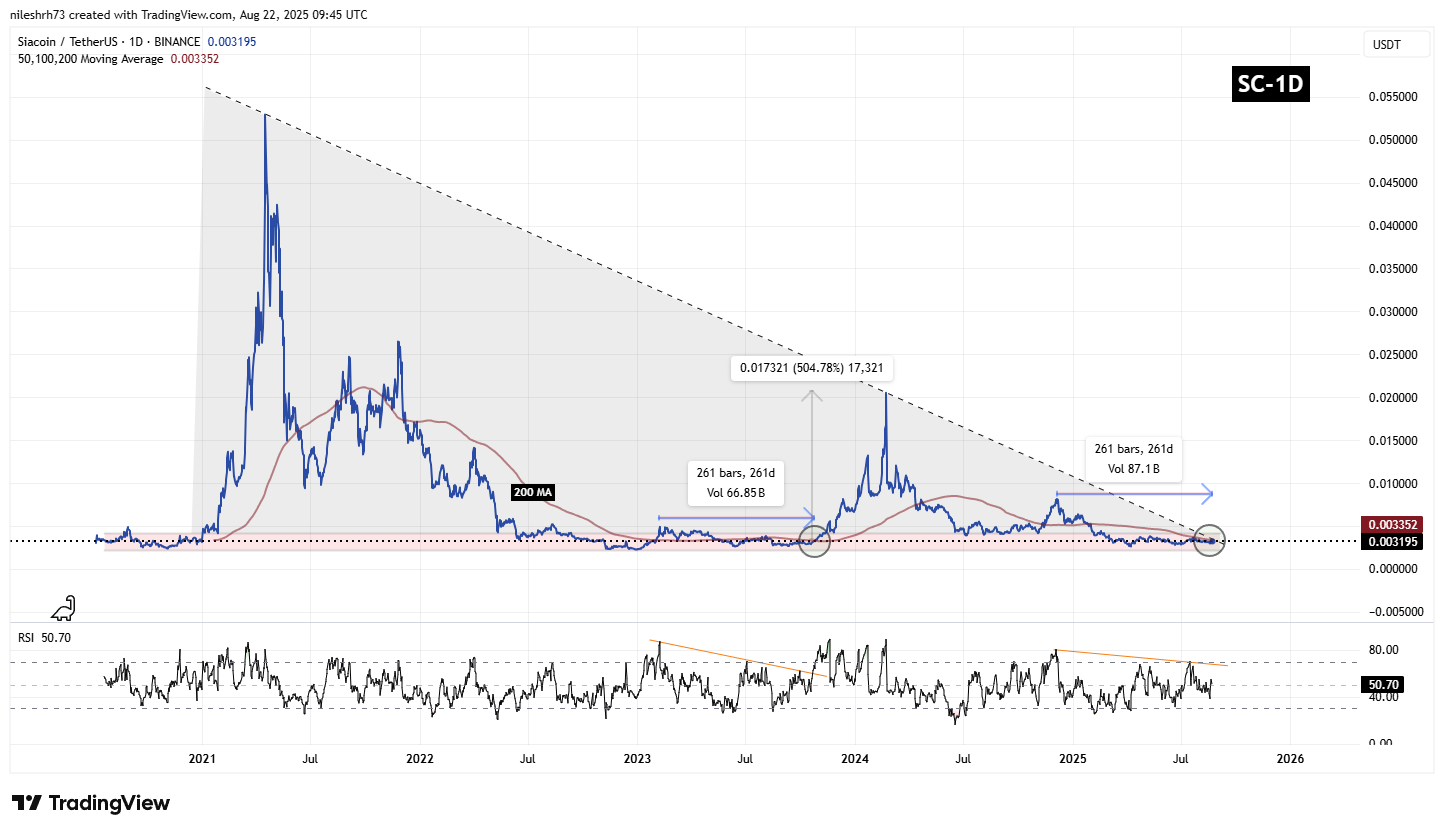
On the daily chart, SC has been moving within a broad descending triangle pattern. While this formation is typically bearish, history shows that if buyers defend the base support, it can instead trigger a bullish reversal.
A striking example occurred in late 2023, when SC bounced perfectly from the triangle’s lower boundary. After a 261-day consolidation range, the token reclaimed its 200-day moving average and broke out above a multi-month RSI resistance line. This technical alignment sparked a remarkable 504% rally, carrying SC toward the upper boundary of the triangle.
Now, the current setup looks eerily similar.
Once again, SC has rebounded off the triangle’s base support and is now approaching its 200-day MA at $0.003352 after nearly the same 261-day consolidation cycle. The RSI structure is also showing signs of repeating its prior breakout formation — a potential prelude to another explosive move.
What’s Next for SC?
If this fractal pattern continues to play out, a decisive close above the 200-day MA and RSI downtrend resistance could be the spark for the next major rally. The first logical upside target would be the late 2024 swing high near $0.0083, which represents an impressive 145% potential upside from current levels.

Disclaimer: This article is for informational purposes only and not financial advice. Always conduct your own research before investing in cryptocurrencies.
The opinions and market insights shared on CoinsProbe represent the views of individual authors based on prevailing market conditions at the time of publication. Cryptocurrency investments carry significant risk and volatility. Readers are encouraged to conduct their own research and seek professional financial advice before making investment decisions. CoinsProbe and its contributors do not accept responsibility for financial losses or decisions made based on published content.
CoinsProbe may publish sponsored articles, affiliate links, or promotional collaborations. All sponsored material is clearly labeled to maintain transparency with our audience. Our editorial decisions remain fully independent, and advertising partnerships do not influence reviews, rankings, or published opinions.
Since 2023, CoinsProbe has delivered reliable insights on cryptocurrency, blockchain, and digital assets. Our content is created by experienced researchers and analysts who follow strict editorial standards focused on accuracy, transparency, and credibility. Every article is carefully reviewed and verified using trusted sources and current market data. We provide unbiased analysis and timely updates covering everything from emerging crypto projects to major industry developments.