Date: Tue, Aug 19, 2025 | 05:55 PM GMT
The cryptocurrency market is experiencing notable selling pressure as Ethereum (ETH) slips to $4,175 from its recent high of $4,780, marking a 4% intraday drop. This weakness has spilled over into the broader altcoin market, including Artificial Superintelligence Alliance (FET).
FET is in the red today, logging over a 7% weekly decline, but beneath the surface, a harmonic pattern is quietly forming on its daily chart—suggesting that a bounce back might be on the horizon.

Harmonic Pattern Hints at Potential Upside
On the daily chart, FET appears to be shaping a Bearish Butterfly harmonic pattern. While the name implies a bearish outcome, the final CD leg of this formation often triggers a bullish continuation as price stretches into the Potential Reversal Zone (PRZ).
The structure began at point X ($0.603), dropped to A, rebounded to B, and then corrected to C near $0.661. From there, FET has started to recover, now trading around $0.671, though it’s still in the early stages of confirming a sustained rebound.
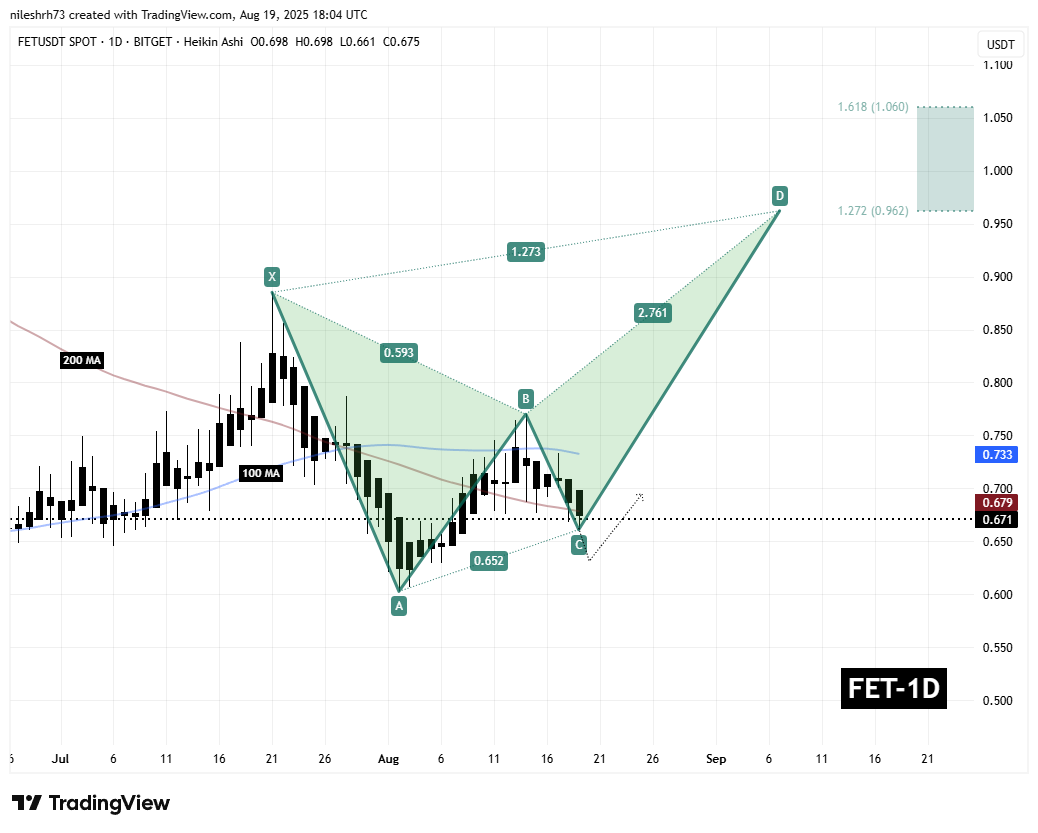
Crucially, FET is trading just below its 200-day moving average ($0.679), a key level that could flip into strong support if reclaimed.
What’s Next for FET?
If buyers defend the C-point support ($0.661) and push price above the 200-day MA, FET could rally toward the 100-day MA at $0.733, which would strengthen the bullish case. A continuation from there could propel the token into the PRZ, spanning $0.96 (1.272 Fibonacci extension) to $1.06 (1.618 extension)—historically critical levels where the Butterfly pattern tends to complete.
However, failure to hold above $0.661 would weaken the structure, delaying confirmation of the CD-leg and exposing FET to further downside testing before any bullish continuation.

Disclaimer: This article is for informational purposes only and not financial advice. Always conduct your own research before investing in cryptocurrencies.
The opinions and market insights shared on CoinsProbe represent the views of individual authors based on prevailing market conditions at the time of publication. Cryptocurrency investments carry significant risk and volatility. Readers are encouraged to conduct their own research and seek professional financial advice before making investment decisions. CoinsProbe and its contributors do not accept responsibility for financial losses or decisions made based on published content.
CoinsProbe may publish sponsored articles, affiliate links, or promotional collaborations. All sponsored material is clearly labeled to maintain transparency with our audience. Our editorial decisions remain fully independent, and advertising partnerships do not influence reviews, rankings, or published opinions.
Since 2023, CoinsProbe has delivered reliable insights on cryptocurrency, blockchain, and digital assets. Our content is created by experienced researchers and analysts who follow strict editorial standards focused on accuracy, transparency, and credibility. Every article is carefully reviewed and verified using trusted sources and current market data. We provide unbiased analysis and timely updates covering everything from emerging crypto projects to major industry developments.