Date: Wed, Aug 06, 2025 | 03:40 PM GMT
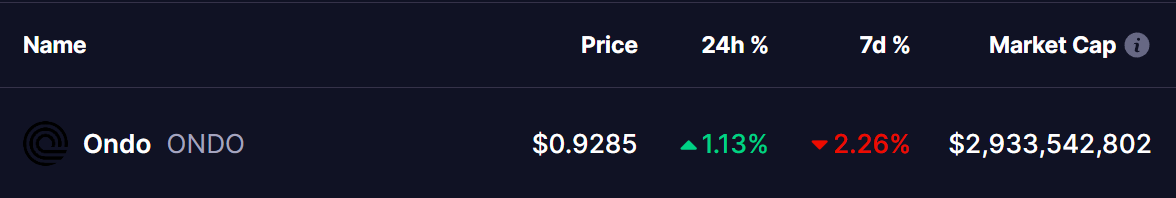
The cryptocurrency market is seeing a modest recovery from its recent sharp decline, with Ethereum (ETH) bouncing to $3,630 from its low of $3,357. This rebound has spilled over to several altcoins, and Ondo (ONDO) is among those showing signs of strength.
ONDO is back in the green today, and its chart is revealing an emerging fractal pattern that closely mirrors a recent bullish setup seen in Mantle (MNT), hinting at a potential upside continuation.
ONDO Mirrors MNT’s Structure
A side-by-side look at the daily charts of MNT and ONDO highlights a clear similarity.
Recently, Mantle (MNT) broke out from a falling wedge pattern and, following a breakout and pullback, formed a bearish ABCD harmonic pattern. After bouncing from its C point, MNT reclaimed its 200-day moving average and surged nearly 40% toward point D.
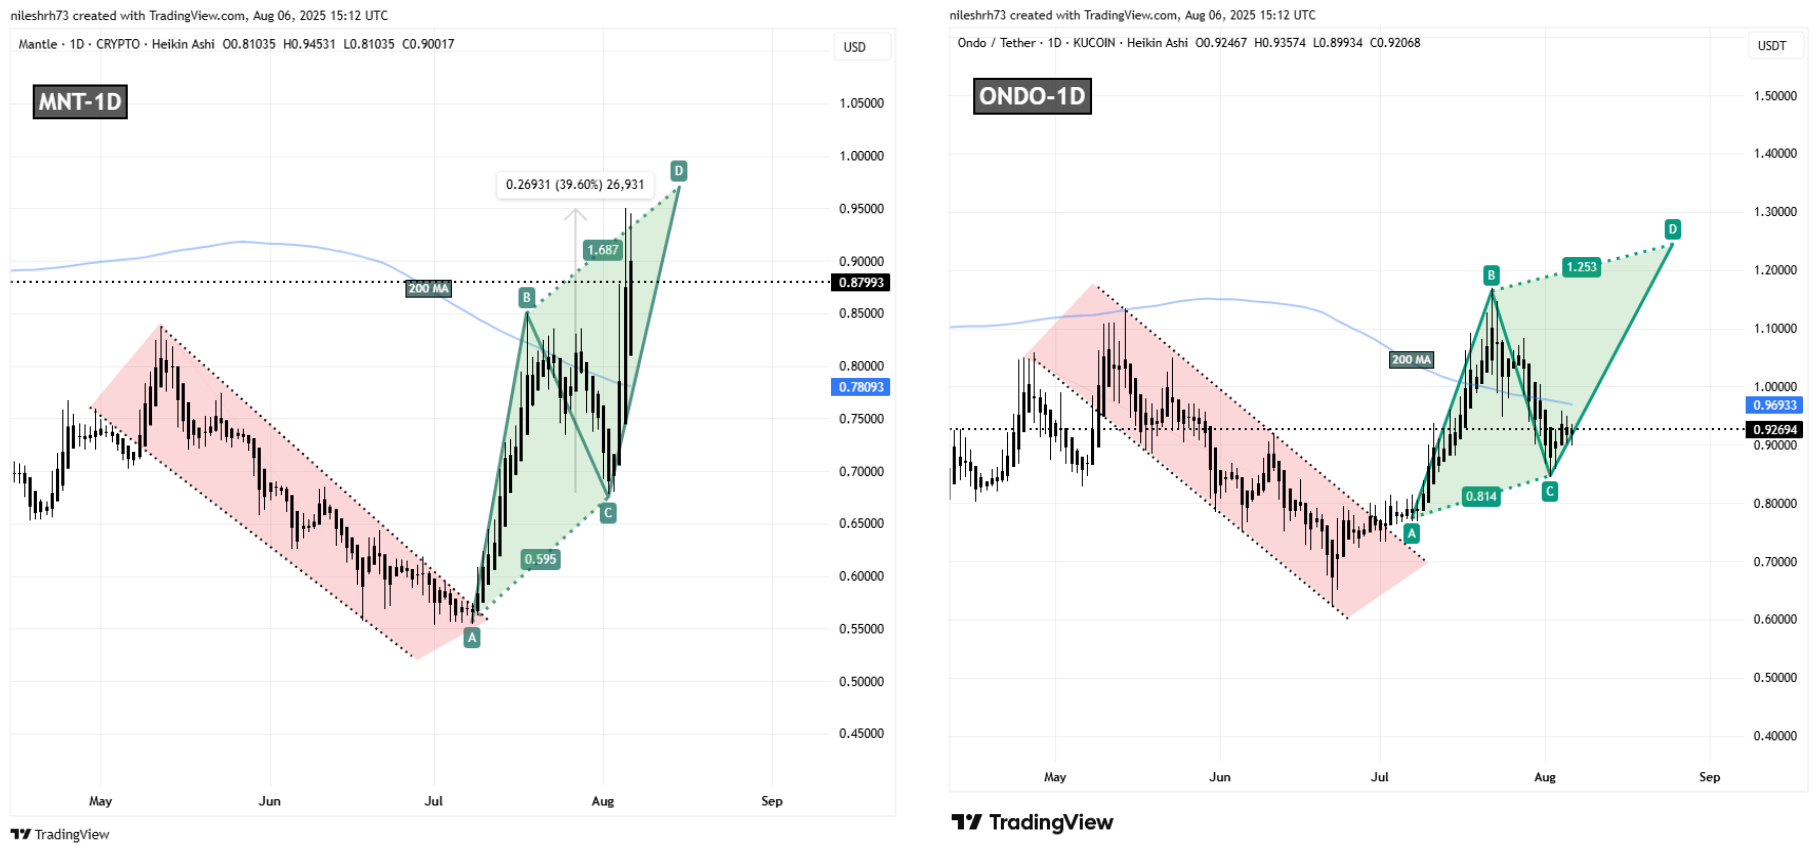
ONDO now appears to be following the same blueprint. The token also broke out from a falling wedge, then formed a bearish ABCD harmonic pattern. It has just bounced from its C point and is now approaching the 200-day moving average resistance at $0.9693.
What’s Next for ONDO?
If ONDO can reclaim the 200-day moving average, it could confirm the fractal pattern and act as a launchpad toward the Potential Reversal Zone (PRZ) at $1.24 — a move that would represent more than 34% upside from current levels.
However, to keep this bullish fractal intact, ONDO must hold above its C point support at $0.8442.
Disclaimer: This article is for informational purposes only and not financial advice. Always conduct your own research before investing in cryptocurrencies.
The opinions and market insights shared on CoinsProbe represent the views of individual authors based on prevailing market conditions at the time of publication. Cryptocurrency investments carry significant risk and volatility. Readers are encouraged to conduct their own research and seek professional financial advice before making investment decisions. CoinsProbe and its contributors do not accept responsibility for financial losses or decisions made based on published content.
CoinsProbe may publish sponsored articles, affiliate links, or promotional collaborations. All sponsored material is clearly labeled to maintain transparency with our audience. Our editorial decisions remain fully independent, and advertising partnerships do not influence reviews, rankings, or published opinions.
Since 2023, CoinsProbe has delivered reliable insights on cryptocurrency, blockchain, and digital assets. Our content is created by experienced researchers and analysts who follow strict editorial standards focused on accuracy, transparency, and credibility. Every article is carefully reviewed and verified using trusted sources and current market data. We provide unbiased analysis and timely updates covering everything from emerging crypto projects to major industry developments.