Date: Sun, June 22, 2025 | 09:50 AM GMT
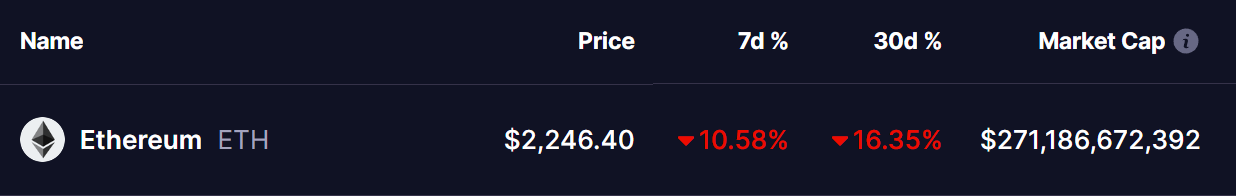
The cryptocurrency market is experiencing a significant downturn as geopolitical tensions between Israel and Iran intensify — now further escalated by the involvement of the United States. Ethereum (ETH), a major player in the crypto space, has not been spared from the impact. After peaking at a monthly high of $2,877, ETH has now slipped to around $2,250.
Over the past seven days, ETH has dropped by 10%, and its monthly decline now sits at 16%. But behind the red candles lies an interesting technical structure — one that could hint at further downside before any recovery begins.
Power of 3 in Play?
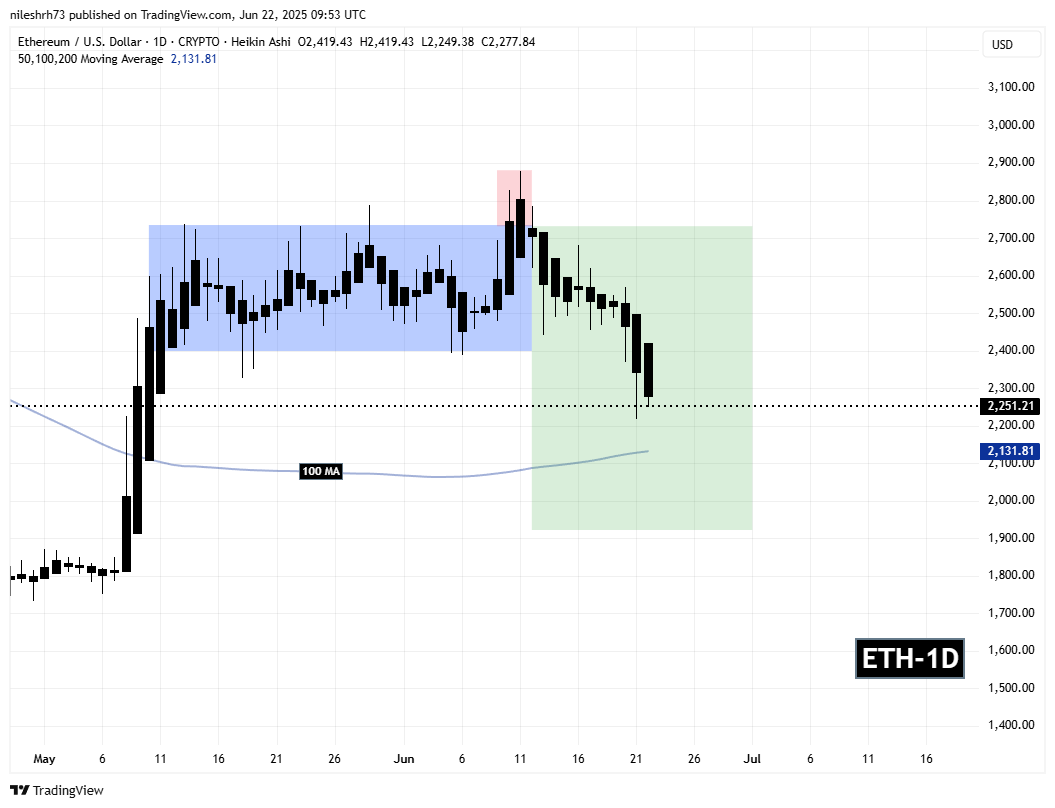
Zooming in on Ethereum’s daily chart, we can see the development of what looks like the classic “Power of 3” structure — a smart money concept that plays out in three stages: Accumulation, Manipulation, and Distribution.
Accumulation Phase
From May 10 to June 9, ETH moved in a sideways range between $2,400 and $2,701. This phase, marked in the blue zone on the chart, reflects a textbook accumulation phase — where price consolidates and market makers quietly build positions without attracting attention.
Manipulation Phase
On June 10, ETH made a sharp breakout above the upper boundary of this range, surging to $2,879. This move likely acted as a “manipulation” or “liquidity grab” — sweeping stop losses and luring in breakout traders before reversing.
Distribution Phase
What followed next was a swift breakdown below the range. ETH breached the $2,701 and $2,400 support levels, triggering the distribution phase — where the smart money starts offloading into the buying pressure created by breakout traders. The current price action shows ETH plunging toward the next major target.
What’s Next for ETH?
If the “Power of 3” pattern continues to unfold as expected, Ethereum could be on its way to retest the next key downside target at $1,921, a potential landing zone based on prior support zones and the measured move from the range breakdown.
However, traders should also pay attention to the 100-day moving average (MA) around $2,131, which could act as temporary support or trigger a bounce.
With the broader market still under heavy geopolitical pressure and sentiment fragile, upcoming daily candles could be highly volatile. Confirmation of a bounce or further downside will likely come through volume and how ETH behaves around the $2,131–$1,921 zone.
Disclaimer: This article is for informational purposes only and does not constitute financial advice. Always conduct your own research before investing in cryptocurrencies.
The opinions and market insights shared on CoinsProbe represent the views of individual authors based on prevailing market conditions at the time of publication. Cryptocurrency investments carry significant risk and volatility. Readers are encouraged to conduct their own research and seek professional financial advice before making investment decisions. CoinsProbe and its contributors do not accept responsibility for financial losses or decisions made based on published content.
CoinsProbe may publish sponsored articles, affiliate links, or promotional collaborations. All sponsored material is clearly labeled to maintain transparency with our audience. Our editorial decisions remain fully independent, and advertising partnerships do not influence reviews, rankings, or published opinions.
Since 2023, CoinsProbe has delivered reliable insights on cryptocurrency, blockchain, and digital assets. Our content is created by experienced researchers and analysts who follow strict editorial standards focused on accuracy, transparency, and credibility. Every article is carefully reviewed and verified using trusted sources and current market data. We provide unbiased analysis and timely updates covering everything from emerging crypto projects to major industry developments.