Date: Mon, June 16, 2025 | 06:16 PM GMT
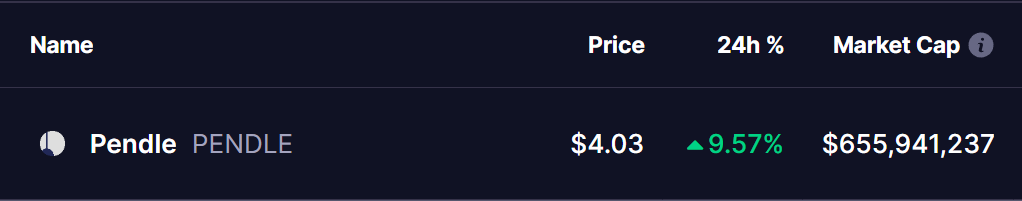
The cryptocurrency market is making a strong comeback this week after suffering from volatility sparked by geopolitical tensions between Israel and Iran. Ethereum (ETH) has risen 3% to reclaim the $2,625 mark, and this broader market rebound is pulling several altcoins into the green — including Pendle (PENDLE).
The DeFi-focused token has posted impressive 9% gains today. Even more interestingly, its chart is signaling the emergence of a well-known “Power of 3” pattern — a possible precursor to a strong bullish continuation.
Power of 3 Pattern in Play
On the 4-hour chart, PENDLE appears to be forming the classic Power of 3 market structure, a technical concept closely associated with institutional “smart money” behavior. This pattern unfolds in three distinct phases:
Accumulation Phase
Between May 18 and June 13, PENDLE moved sideways within a narrow range between $4.69 and $3.83. This quiet period, characterized by low volatility and minimal directional bias, is often where institutions quietly accumulate their positions without tipping off retail traders. The range is visible as a rectangular zone on the chart.
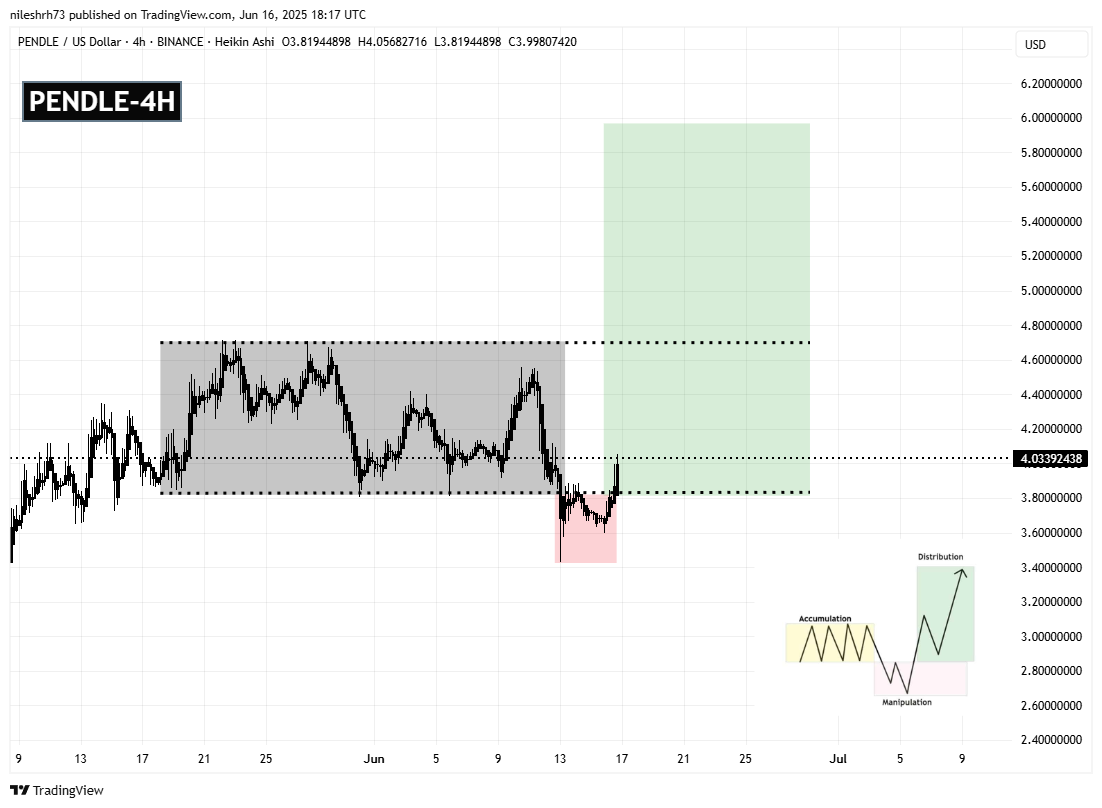
Manipulation Phase
On June 13, the price broke sharply below the range support, dropping to a low of $3.42. This sudden drop likely triggered stop-losses and caused panic selling — a classic “manipulation” move aimed at flushing out weak hands before the real rally begins.
Expansion Phase
Immediately after bottoming out, PENDLE rebounded aggressively, reclaiming the key $3.83 level and pushing higher. This bounce marks the beginning of the Expansion Phase, where price moves sharply in the true direction of the trend. PENDLE is now testing the $4.69 resistance level, previously the top of the accumulation zone.
What’s Next for PENDLE?
If the token breaks and holds above $4.69, it would validate the breakout from the Power of 3 pattern and signal a continuation of the bullish trend. In this scenario, the next technical target sits near $5.96, a level derived from the height of the accumulation zone projected upward — indicating a potential 47% rally from the breakout point.
Overall, PEDNLE’s chart is showing early signs of a rebound, backed by a textbook setup. While global tensions remain a wildcard that could override technical patterns, the short-term outlook looks promising.

Disclaimer: This article is for informational purposes only and not financial advice. Always conduct your own research before investing in cryptocurrencies.
The opinions and market insights shared on CoinsProbe represent the views of individual authors based on prevailing market conditions at the time of publication. Cryptocurrency investments carry significant risk and volatility. Readers are encouraged to conduct their own research and seek professional financial advice before making investment decisions. CoinsProbe and its contributors do not accept responsibility for financial losses or decisions made based on published content.
CoinsProbe may publish sponsored articles, affiliate links, or promotional collaborations. All sponsored material is clearly labeled to maintain transparency with our audience. Our editorial decisions remain fully independent, and advertising partnerships do not influence reviews, rankings, or published opinions.
Since 2023, CoinsProbe has delivered reliable insights on cryptocurrency, blockchain, and digital assets. Our content is created by experienced researchers and analysts who follow strict editorial standards focused on accuracy, transparency, and credibility. Every article is carefully reviewed and verified using trusted sources and current market data. We provide unbiased analysis and timely updates covering everything from emerging crypto projects to major industry developments.