
Date: Fri, May 30, 2025 | 03:32 PM GMT
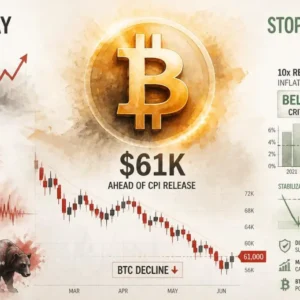
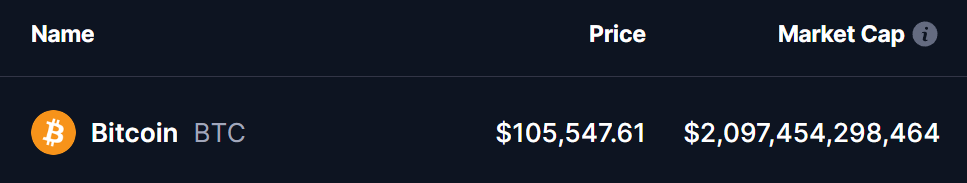
The cryptocurrency market has staged an impressive rebound this quarter, with Bitcoin (BTC) leading the charge. After climbing over 28% in Q2, BTC is now trading above $105,000. This comes after the world’s largest cryptocurrency touched a new all-time high of $111,917 earlier this month—before facing a slight pullback, sparking speculation on whether BTC has already topped or is merely consolidating for another move higher.
However, a closer look at historical price behavior may help clear the fog around Bitcoin’s next move.
Bitcoin’s Fractal Signals More Upside
According to insights from prominent crypto analyst CryptoAmsterdam, Bitcoin could be in the middle of repeating a well-established historical pattern—one that has led to explosive rallies in the past.
The chart shows BTC entering a “chop zone” just after breaking previous highs, a behavior it has displayed in previous cycles before moving much higher. This sideways consolidation, marked by a red highlight, appears nearly identical to the consolidation seen in early July 2017 and again in early January 2021—both of which preceded significant bull runs.
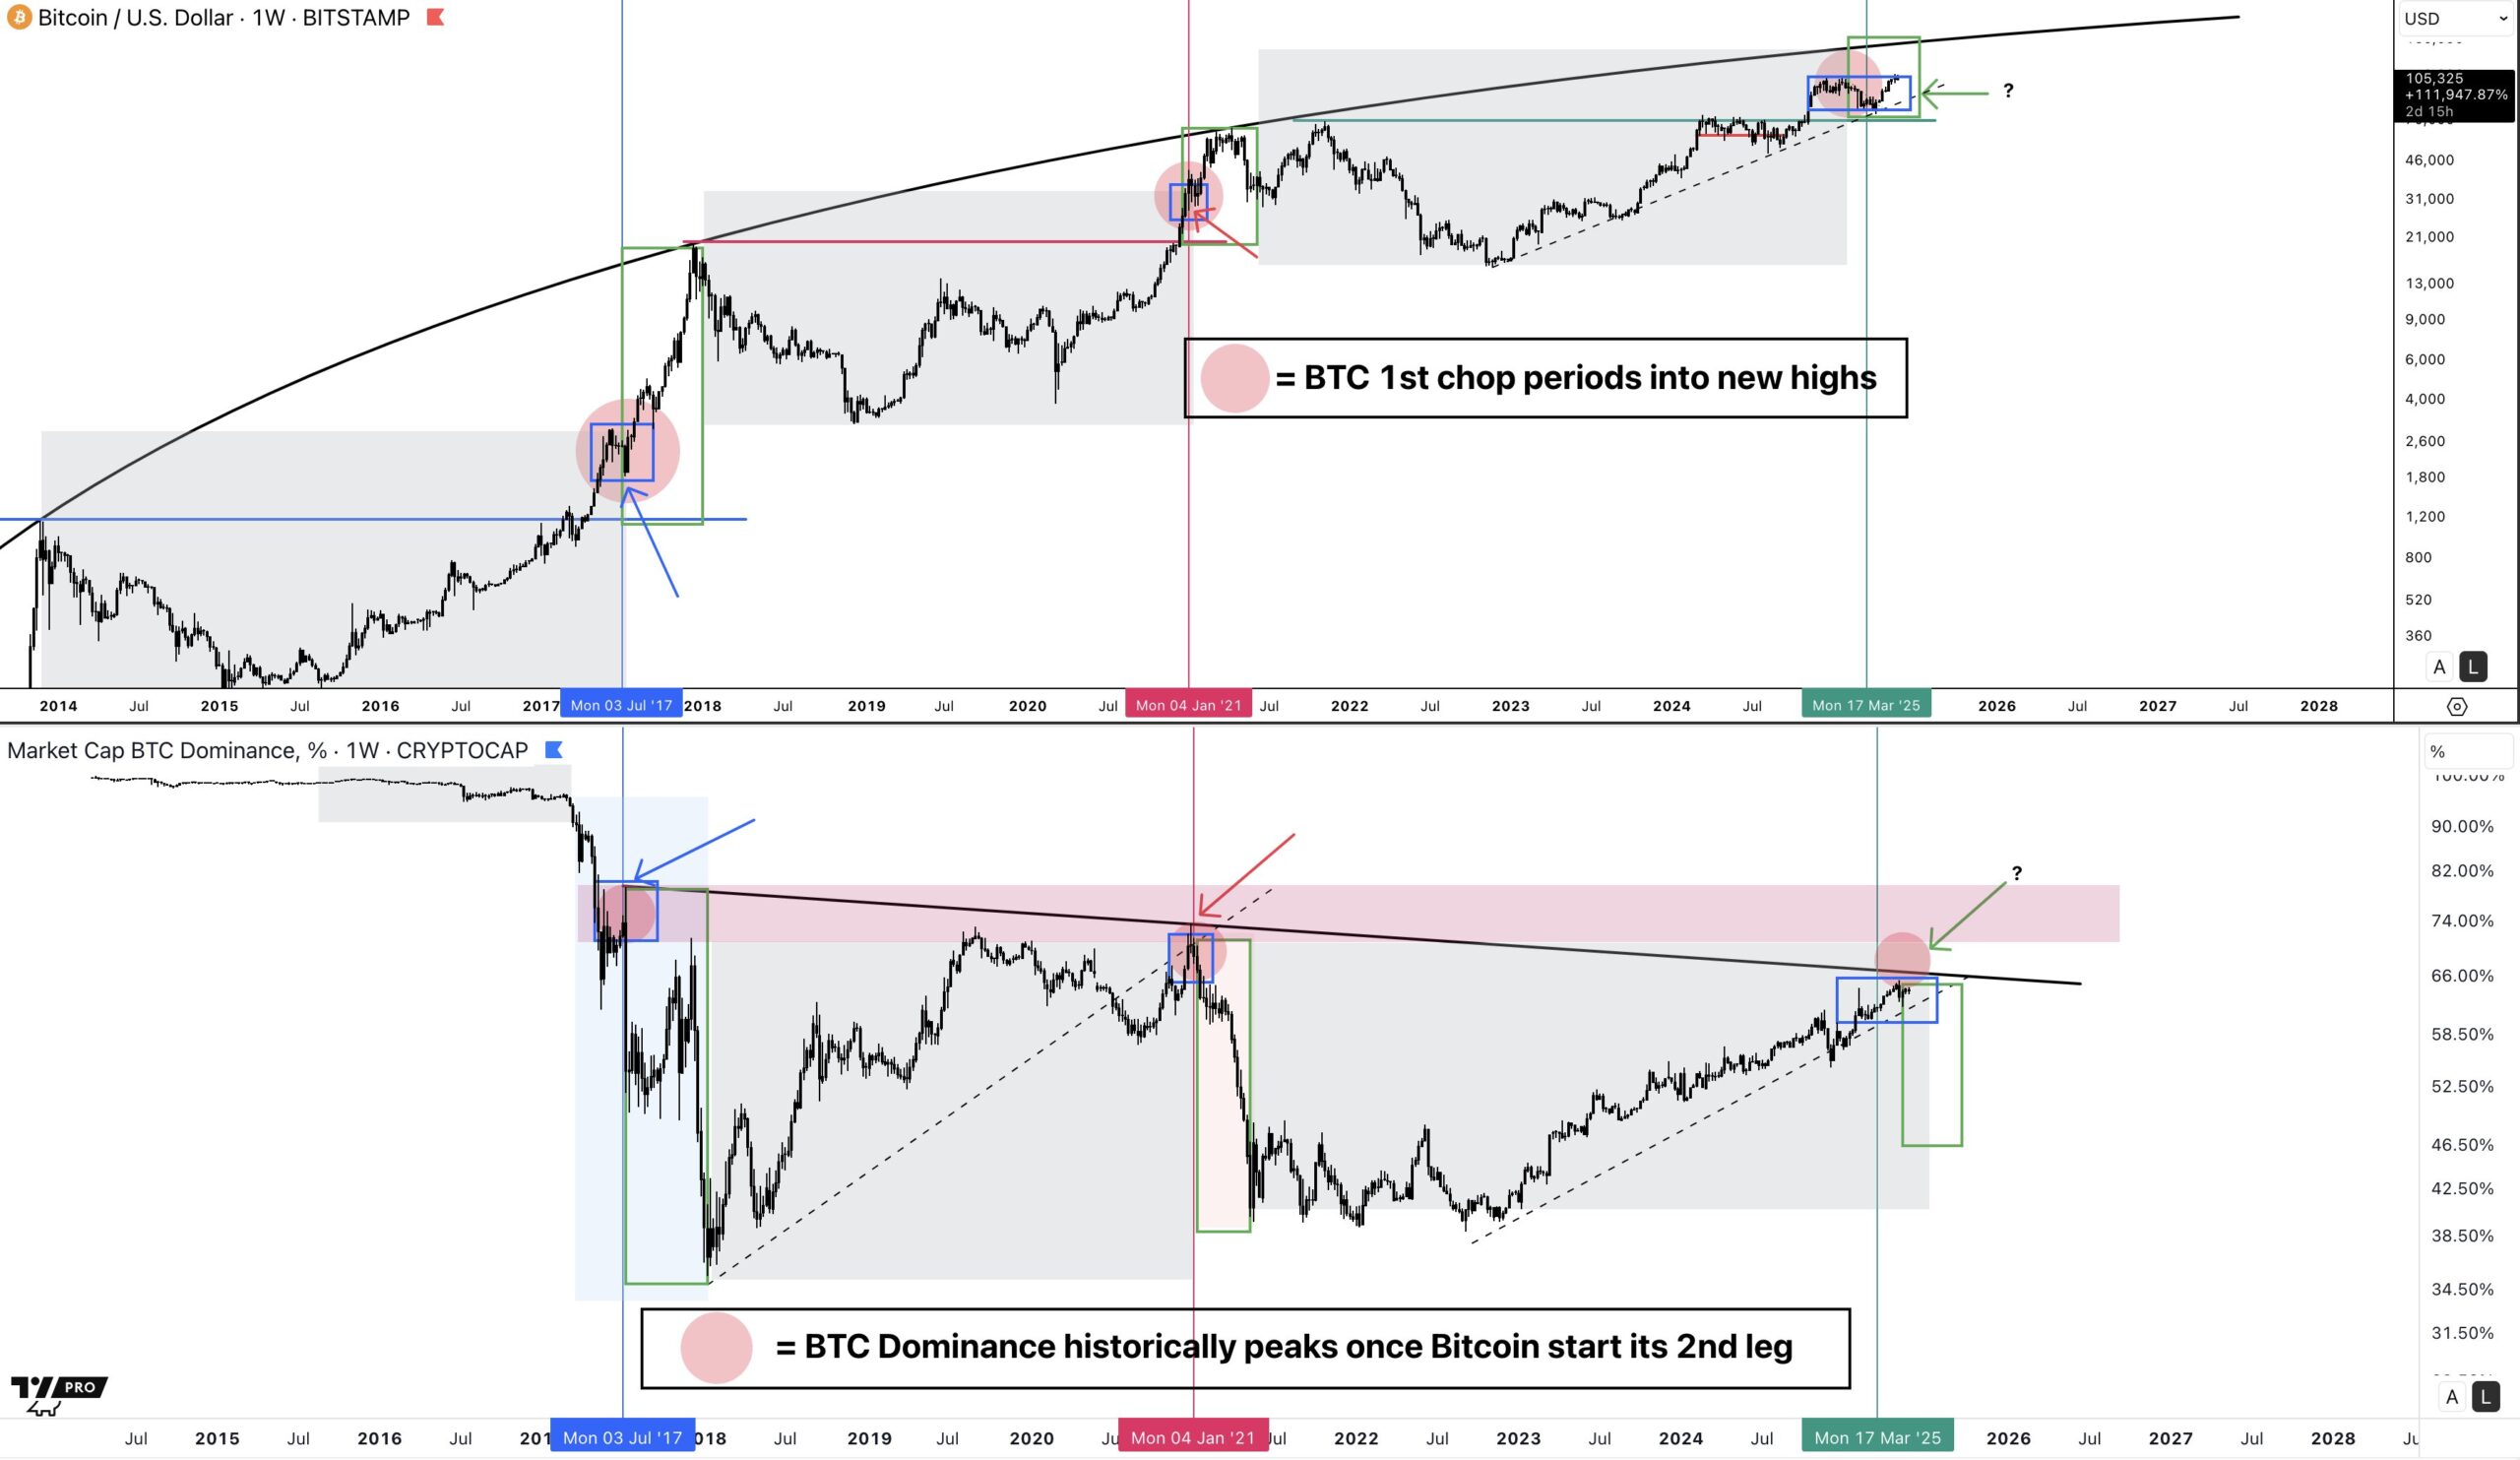
If this pattern holds, BTC could be forming its “first leg” into new highs and may soon begin its second explosive rally.
BTC Dominance Offers a Crucial Clue
The second half of the chart focuses on Bitcoin Dominance (BTC.D)—a metric that measures BTC’s share of the total cryptocurrency market. Historically, Bitcoin Dominance tends to peak right before Bitcoin starts its second leg up in the cycle.
In both 2017 and 2021, BTC dominance reached its highest point during the consolidation phase and then sharply declined as BTC skyrocketed and capital rotated into altcoins. We are seeing a very similar setup today: BTC.D is approaching a trendline resistance and has entered a historically critical zone.
If dominance peaks again in the coming weeks, it could signal the beginning of BTC’s second leg—potentially sending prices into uncharted territory.
What’s Next?
If Bitcoin mirrors its past behavior, the current sideways movement above $100K could be a launchpad, not a ceiling. Historical fractals and the BTC.D trend suggest we may be just at the midway point of this cycle, not the end.
That said, technicals only paint part of the picture. Macroeconomic conditions, ETF flows, and regulatory developments will also play crucial roles in determining whether Bitcoin reaches $125,000—or beyond—in this bull run.
Disclaimer: This article is for informational purposes only and not financial advice. Always conduct your own research before investing in cryptocurrencies.
The opinions and market insights shared on CoinsProbe represent the views of individual authors based on prevailing market conditions at the time of publication. Cryptocurrency investments carry significant risk and volatility. Readers are encouraged to conduct their own research and seek professional financial advice before making investment decisions. CoinsProbe and its contributors do not accept responsibility for financial losses or decisions made based on published content.
CoinsProbe may publish sponsored articles, affiliate links, or promotional collaborations. All sponsored material is clearly labeled to maintain transparency with our audience. Our editorial decisions remain fully independent, and advertising partnerships do not influence reviews, rankings, or published opinions.
Since 2023, CoinsProbe has delivered reliable insights on cryptocurrency, blockchain, and digital assets. Our content is created by experienced researchers and analysts who follow strict editorial standards focused on accuracy, transparency, and credibility. Every article is carefully reviewed and verified using trusted sources and current market data. We provide unbiased analysis and timely updates covering everything from emerging crypto projects to major industry developments.