

Date: Mon, May 05, 2025 | 03:47 AM GMT
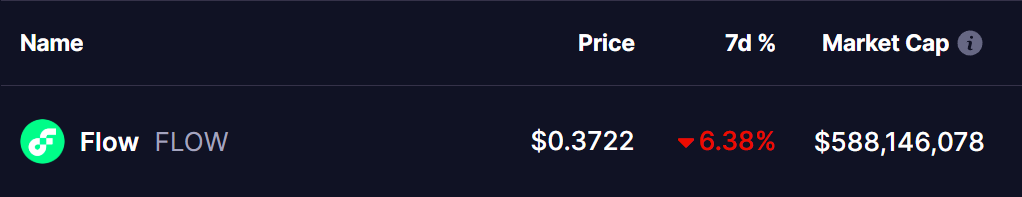
After a brutal Q1 where Ethereum (ETH) alone crashed 45%, the crypto market is finally showing signs of a comeback. ETH has bounced 30% from its April 7 low—and it’s not the only one. Flow (FLOW), a once-sidelined altcoin, has surged nearly 37% since its April dip.
But FLOW has cooled off recently, down more than 6% over the past week. So, is this just a healthy pullback—or the start of another bearish leg? A closer look at the chart may hold the answer.
A Bullish Inverse Head and Shoulders Is Forming
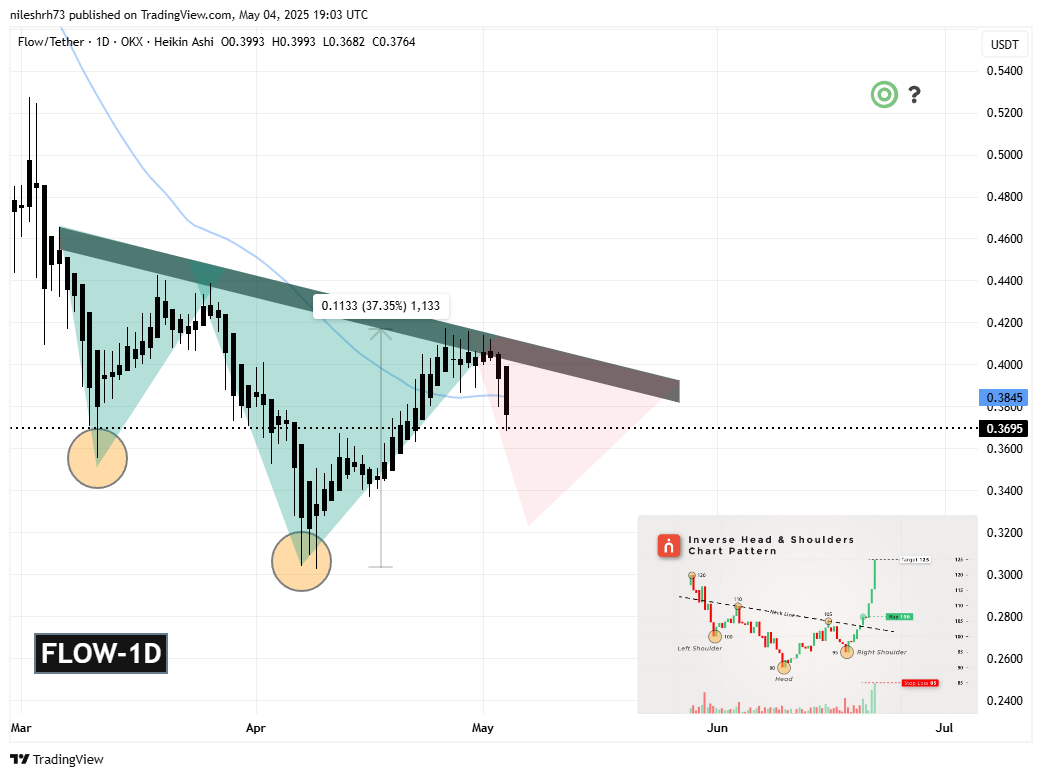
On the daily chart, FLOW is shaping up a textbook Inverse Head and Shoulders pattern—a classic signal of a bullish reversal. This setup often suggests that selling pressure is fading and a trend change could be coming.
Let’s break it down:
- Left Shoulder: FLOW found support around $0.35 in mid-March after getting rejected near the $0.46 zone.
- Head: The token plunged to a low of around $0.30 on April 7, forming the head of the pattern.
- Right Shoulder: Recently, FLOW rebounded sharply to retest the neckline near $0.41, before pulling back again to $0.37, likely completing the right shoulder.
What’s Next for FLOW
If this pattern plays out fully, FLOW may dip slightly more to confirm support around the $0.32–$0.34 zone, finishing off the right shoulder. A breakout above the neckline (around $0.41–$0.42) could then trigger a strong move higher.
Target? The projected upside from this breakout is around $0.52, which would represent a 52% rally from the current price.
Of course, patterns don’t guarantee outcomes. Volume confirmation and momentum will be key in validating the breakout. But for now, the structure is promising.
Disclaimer: This article is for informational purposes only and not financial advice. Always conduct your own research before investing in cryptocurrencies.
The opinions and market insights shared on CoinsProbe represent the views of individual authors based on prevailing market conditions at the time of publication. Cryptocurrency investments carry significant risk and volatility. Readers are encouraged to conduct their own research and seek professional financial advice before making investment decisions. CoinsProbe and its contributors do not accept responsibility for financial losses or decisions made based on published content.
CoinsProbe may publish sponsored articles, affiliate links, or promotional collaborations. All sponsored material is clearly labeled to maintain transparency with our audience. Our editorial decisions remain fully independent, and advertising partnerships do not influence reviews, rankings, or published opinions.
Since 2023, CoinsProbe has delivered reliable insights on cryptocurrency, blockchain, and digital assets. Our content is created by experienced researchers and analysts who follow strict editorial standards focused on accuracy, transparency, and credibility. Every article is carefully reviewed and verified using trusted sources and current market data. We provide unbiased analysis and timely updates covering everything from emerging crypto projects to major industry developments.