
Key Takeaways
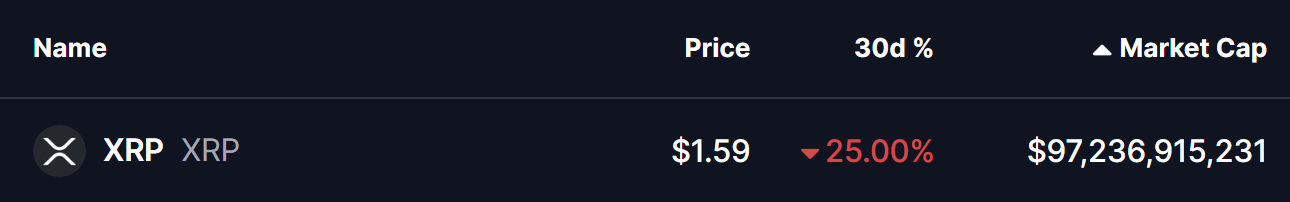
- XRP is down over 25% in 30 days, underperforming most major altcoins.
- Price has lost both the 50-week and 100 MA, signaling weakening momentum.
- XRP’s current structure closely mirrors CRO’s 2024 fractal, which led to a ~50% drop.
- If the pattern holds, XRP could consolidate near $1.60 before targeting deeper support around $0.30.
- Reclaiming the 50-week MA near $2.40 would invalidate the bearish fractal.
The broader altcoins crypto market has faced heavy selling pressure over the past 30 days, with Ethereum (ETH) sliding more than 28%, keeping sentiment weak across the board.
Among major altcoins, XRP has been one of the weakest performers, dropping over 16% in the past week and extending its 30-day decline to 25%. More importantly, a growing number of traders are now pointing to a fractal similarity with Cronos (CRO) — a setup that previously led to a deep corrective move.
If history rhymes, XRP may not be done falling just yet.
Fractal Setup Hints at Further Downside
A side-by-side comparison of CRO and XRP reveals some striking similarities in structure.
Back in late 2024, Cronos was rejected from the upper boundary of a right-angled ascending broadening wedge before entering a sharp corrective phase. Soon after, CRO slipped below its 50 and 100 moving averages, signaling weakening momentum. What followed was a prolonged sell-off that eventually stretched into a near 50% drawdown, pushing price back into its accumulation support zone.
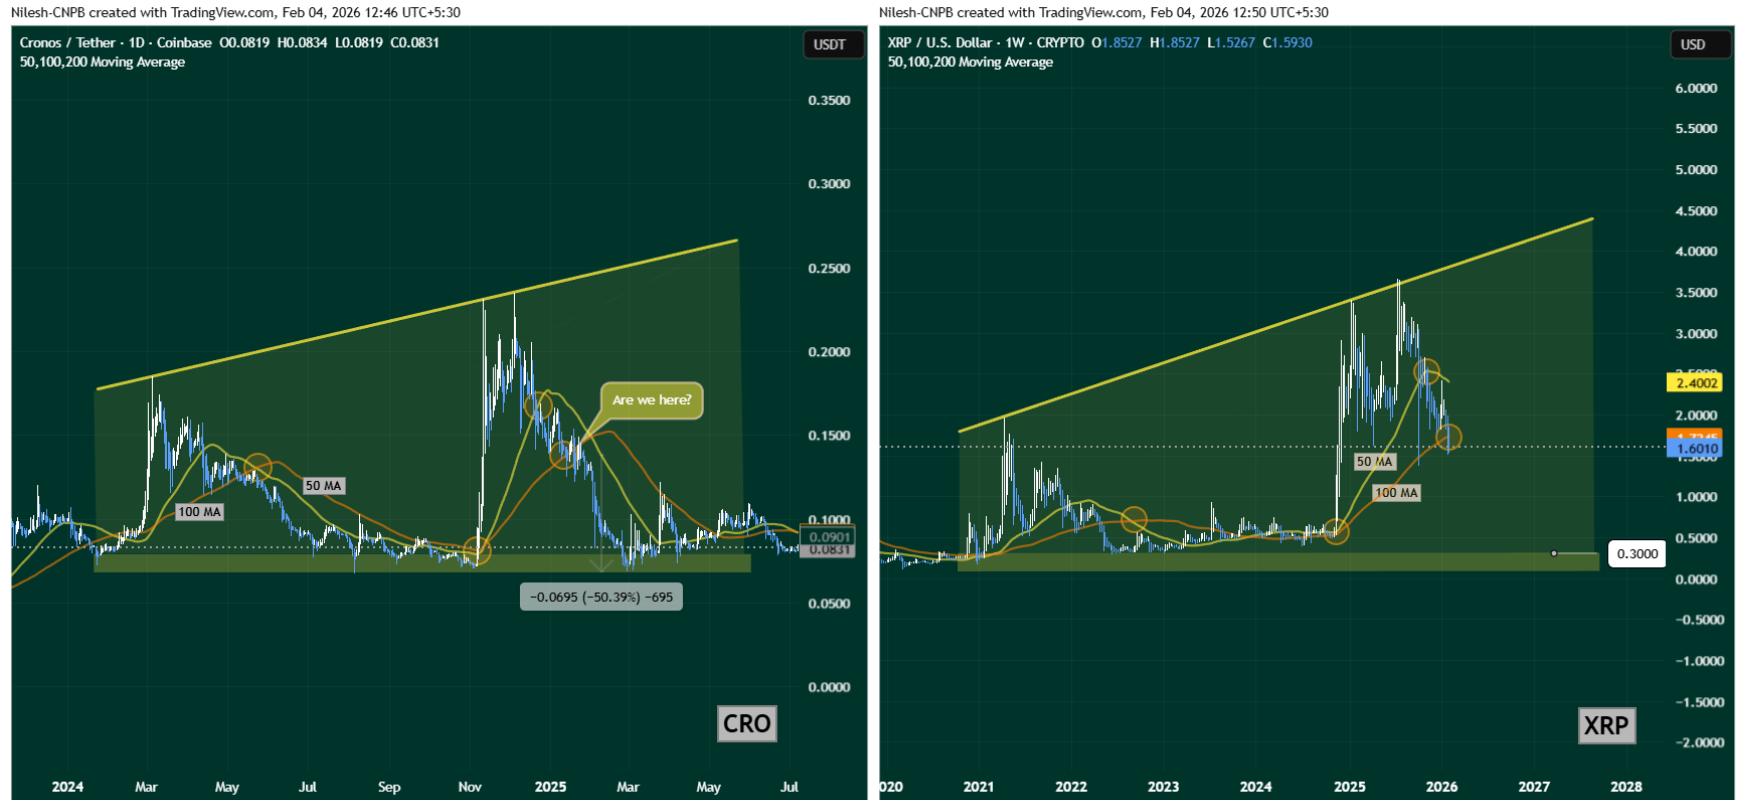
XRP now appears to be following a very similar script.
After peaking near upper resistance around $3.65 in mid-2025, XRP rolled over and entered a steep correction. Price first lost its 50-week moving average, and this week confirmed a breakdown below the 100 MA — closely mirroring CRO’s mid-correction phase that later triggered its larger drop.
With the fractal lining up almost point-for-point, the technical picture suggests that bearish momentum remains firmly in control.
The moving averages are rolling over, price is making lower highs, and XRP is struggling to regain any meaningful strength — all classic signs of a market still searching for a bottom.
What’s Next for XRP?
If this fractal continues to play out, XRP may first consolidate around the current $1.60 area as short-term buyers attempt to stabilize price.
However, if selling pressure persists, the chart opens the door for a deeper move toward the long-term support zone near $0.30 over the coming months — roughly aligning with the magnitude of CRO’s historical decline.
On the flip side, bulls still have a chance to invalidate this bearish setup.
A strong reclaim of the 50-week moving average near $2.40 would be an early sign that momentum is shifting back in XRP’s favor and that this fractal comparison may fail.
For now though, the weekly structure keeps XRP technically vulnerable. Until key moving averages are recovered, the path of least resistance appears tilted to the downside, with traders closely watching whether this familiar CRO-style fractal plays out once again.
Disclaimer: The views and analysis presented in this article are for informational purposes only and reflect the author’s perspective, not financial advice. Technical patterns and indicators discussed are subject to market volatility and may or may not yield the anticipated results. Investors are advised to exercise caution, conduct independent research, and make decisions aligned with their individual risk tolerance.
About Author: Nilesh Hembade is the Founder and Lead Author of Coinsprobe, with over 5 years of experience in the cryptocurrency and blockchain industry. Since launching Coinsprobe in 2023, he has been providing daily, research-driven insights through in-depth market analysis, on-chain data, and technical research.

The opinions and market insights shared on CoinsProbe represent the views of individual authors based on prevailing market conditions at the time of publication. Cryptocurrency investments carry significant risk and volatility. Readers are encouraged to conduct their own research and seek professional financial advice before making investment decisions. CoinsProbe and its contributors do not accept responsibility for financial losses or decisions made based on published content.
CoinsProbe may publish sponsored articles, affiliate links, or promotional collaborations. All sponsored material is clearly labeled to maintain transparency with our audience. Our editorial decisions remain fully independent, and advertising partnerships do not influence reviews, rankings, or published opinions.
Since 2023, CoinsProbe has delivered reliable insights on cryptocurrency, blockchain, and digital assets. Our content is created by experienced researchers and analysts who follow strict editorial standards focused on accuracy, transparency, and credibility. Every article is carefully reviewed and verified using trusted sources and current market data. We provide unbiased analysis and timely updates covering everything from emerging crypto projects to major industry developments.