
Date: Fri, Dec 19 2025 | 06:45 AM GMT
The broader cryptocurrency market has been experiencing choppy price action over the past several weeks, a phase that began after the sharp sell-off on October 10. That correction dragged Ethereum (ETH) down by nearly 27% over the last 60 days, keeping sustained pressure on major altcoins, including Xrp (XRP).
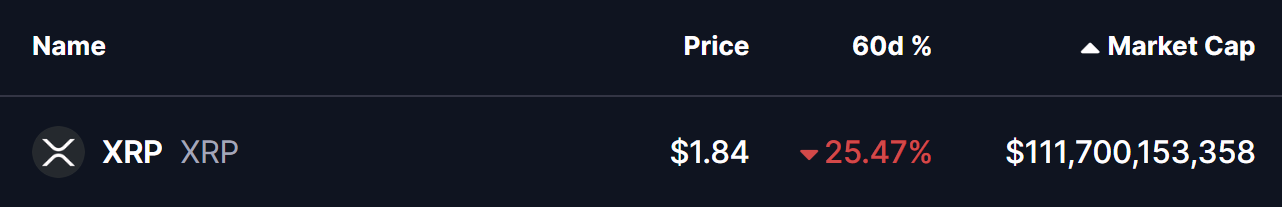
XRP has declined by more than 25% over the same period, reflecting the broader risk-off environment. However, while price action has remained weak on the surface, the daily chart is now starting to reveal an emerging structure that could set the stage for a recovery attempt if key levels continue to hold.
Harmonic Pattern Signals Potential Upside
On the daily timeframe, XRP appears to be forming a Bearish Cypher harmonic pattern — a structure that often produces upside momentum during its final CD leg before price reaches the Potential Reversal Zone (PRZ).
The pattern began at point X near the $2.69 region, where XRP topped out before entering a sharp corrective move. Price then declined into point A, followed by a rebound toward point B near the 0.382 retracement zone. From there, XRP rolled over again and extended lower into point C around $1.77, completing the core structure of the pattern.
Since tagging this level, XRP has started to stabilize and grind higher, now trading near the $1.84 area. This slow recovery suggests selling pressure may be easing, with buyers beginning to defend the recent lows. The shape and proportions of the pattern remain intact, keeping the harmonic setup technically valid for now.
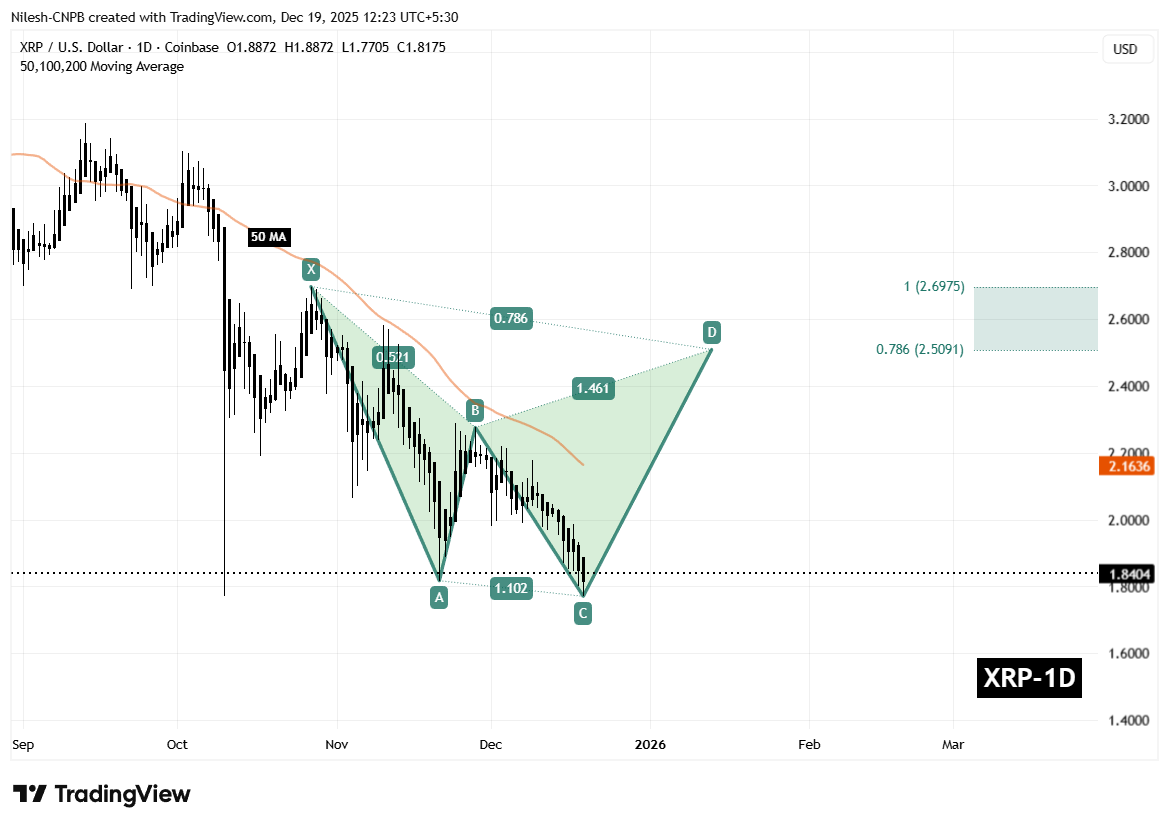
A key technical factor aligning with this structure is the 50-day moving average, currently positioned near $2.16. This level has consistently acted as dynamic resistance throughout the downtrend and represents an important hurdle for bulls to overcome.
What’s Next for XRP?
In the short term, the most critical level to monitor is the C-leg support around $1.77. As long as XRP holds above this zone, the harmonic pattern remains active and the bullish CD-leg scenario stays in play.
If price continues to build strength from this base, the next major test will be a reclaim of the 50-day moving average near $2.16. A decisive move above this level would signal improving momentum and could accelerate upside continuation.
Based on the harmonic structure, the projected upside targets sit within the Potential Reversal Zone, defined between the 0.786 Fibonacci extension near $2.50 and the 1.0 extension around $2.69. This zone represents the area where the Cypher pattern is expected to complete and where stronger resistance or a pause in the move could emerge.
On the downside, failure to hold above $1.77 would weaken the bullish setup significantly. A breakdown below this support could invalidate the pattern and expose XRP to deeper downside pressure before any sustainable recovery attempt can develop.
For now, the chart suggests XRP is at a technically important juncture. While confirmation is still needed, the presence of a well-formed harmonic structure indicates that a short- to medium-term bounce remains a realistic possibility if buyers can defend current levels and reclaim key resistance zones.
Disclaimer: The views and analysis presented in this article are for informational purposes only and reflect the author’s perspective, not financial advice. Technical patterns and indicators discussed are subject to market volatility and may or may not yield the anticipated results. Investors are advised to exercise caution, conduct independent research, and make decisions aligned with their individual risk tolerance.

The opinions and market insights shared on CoinsProbe represent the views of individual authors based on prevailing market conditions at the time of publication. Cryptocurrency investments carry significant risk and volatility. Readers are encouraged to conduct their own research and seek professional financial advice before making investment decisions. CoinsProbe and its contributors do not accept responsibility for financial losses or decisions made based on published content.
CoinsProbe may publish sponsored articles, affiliate links, or promotional collaborations. All sponsored material is clearly labeled to maintain transparency with our audience. Our editorial decisions remain fully independent, and advertising partnerships do not influence reviews, rankings, or published opinions.
Since 2023, CoinsProbe has delivered reliable insights on cryptocurrency, blockchain, and digital assets. Our content is created by experienced researchers and analysts who follow strict editorial standards focused on accuracy, transparency, and credibility. Every article is carefully reviewed and verified using trusted sources and current market data. We provide unbiased analysis and timely updates covering everything from emerging crypto projects to major industry developments.