Date: Sun, Oct 26, 2025 | 07:35 AM GMT
The broader cryptocurrency market is trading with a steady upside tone today, as both Bitcoin (BTC) and Ethereum (ETH) post modest gains. This improving sentiment is also lifting several altcoins including — Worldcoin (WLD)
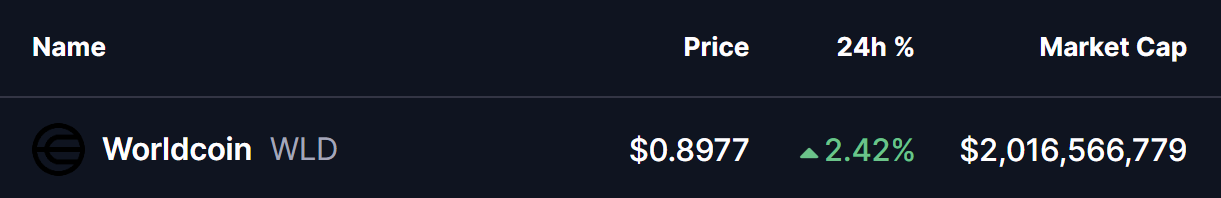
WLD is currently up 2% today, and more importantly, its latest chart structure is revealing a harmonic formation that may set the stage for a potential bullish move in the coming sessions.
Cypher Harmonic Pattern in Play
On the 4-hour chart, Worldcoin (WLD) is forming a Bearish Cypher harmonic pattern. Despite its “bearish” name, this setup often involves a strong bullish rally in the CD leg before the price reaches the Potential Reversal Zone (PRZ) — the point where the overall pattern typically completes.
The pattern began at Point X ($1.050), dropped to Point A, rebounded toward Point B, and then sharply declined to Point C ($0.810). From there, WLD started to recover and is now trading around $0.897, successfully reclaiming the 50-hour moving average (MA) at $0.888 — a positive sign that buyers are gradually regaining control.
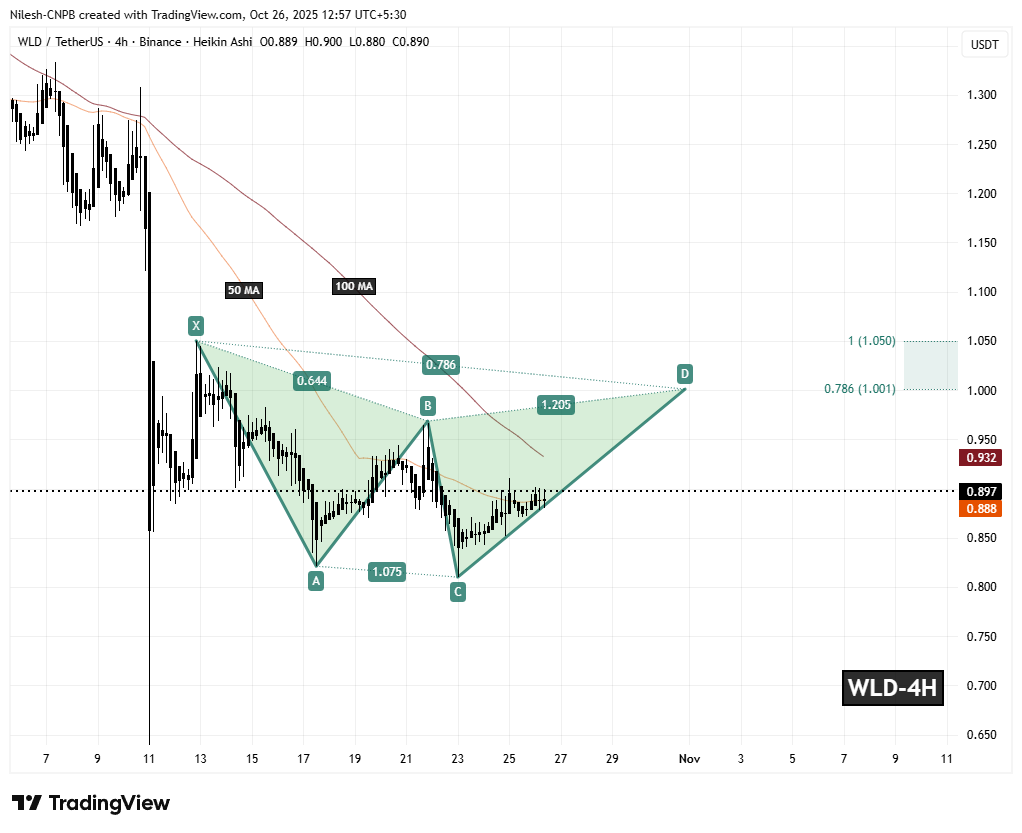
The next key test lies at the 100-hour MA, currently around $0.932. A confirmed breakout above this level could signal the start of a stronger bullish continuation, pushing WLD toward higher Fibonacci extension zones.
What’s Next for WLD?
If bulls continue to defend the 50-hour MA and manage a sustained push above the 100-hour MA, the harmonic pattern projects a potential upside target between $1.00 (0.786 Fibonacci extension) and $1.05 (1.0 extension). This range marks the completion zone of the Bearish Cypher, which typically acts as a major resistance area where traders may look to secure profits.
However, if WLD fails to hold support at the 50-hour MA, short-term momentum could soften, leading to sideways consolidation before any new bullish attempt emerges.
Disclaimer: The views and analysis presented in this article are for informational purposes only and reflect the author’s perspective, not financial advice. Technical patterns and indicators discussed are subject to market volatility and may or may not yield the anticipated results. Investors are advised to exercise caution, conduct independent research, and make decisions aligned with their individual risk tolerance.

The opinions and market insights shared on CoinsProbe represent the views of individual authors based on prevailing market conditions at the time of publication. Cryptocurrency investments carry significant risk and volatility. Readers are encouraged to conduct their own research and seek professional financial advice before making investment decisions. CoinsProbe and its contributors do not accept responsibility for financial losses or decisions made based on published content.
CoinsProbe may publish sponsored articles, affiliate links, or promotional collaborations. All sponsored material is clearly labeled to maintain transparency with our audience. Our editorial decisions remain fully independent, and advertising partnerships do not influence reviews, rankings, or published opinions.
Since 2023, CoinsProbe has delivered reliable insights on cryptocurrency, blockchain, and digital assets. Our content is created by experienced researchers and analysts who follow strict editorial standards focused on accuracy, transparency, and credibility. Every article is carefully reviewed and verified using trusted sources and current market data. We provide unbiased analysis and timely updates covering everything from emerging crypto projects to major industry developments.