Date: Sat, March 22, 2025 | 09:52 AM GMT
The crypto market is showing mixed signs of a rebound as Ethereum (ETH) bounces back with a 3.87% weekly gain and is now trading near the $2,000 mark—a promising shift after a rather choppy start to March. As overall sentiment slowly begins to shift in a more positive direction, memecoins like SPX6900 (SPX) and Turbo (TURBO) are starting to show upside momentum.
Both tokens had been under heavy pressure over the past few months, but their current weekly price actions and technical setups hint at a potential recovery brewing on the horizon.

SPX6900 (SPX)
SPX’s weekly chart highlights a classic ascending broadening wedge pattern, which is generally considered a bearish formation. However, there is still room for an upside move before any potential breakdown.
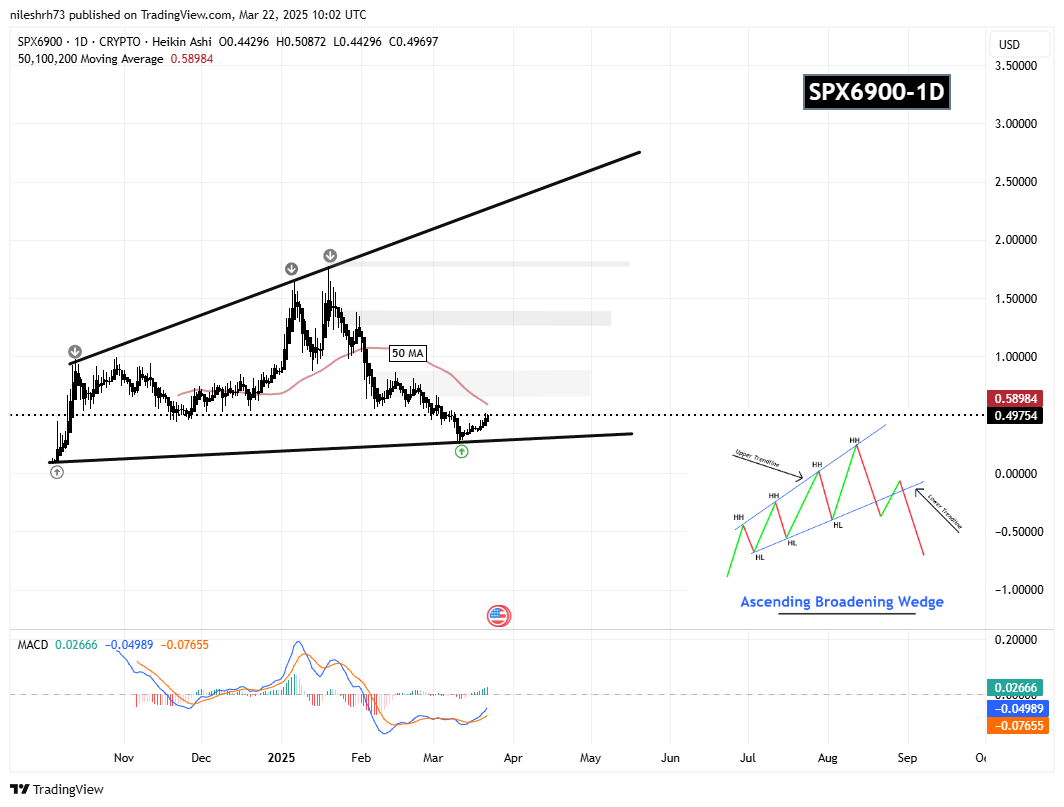
As seen in the chart, SPX faced strong resistance near its all-time high of $1.77, which marked the top of the wedge. Since then, it retraced back to the lower wedge support around $0.25, and is now attempting a bounce, currently trading near $0.49.
More importantly, SPX is now approaching the 50-day moving average resistance at $0.58. A breakout above this level could open doors toward $1.38, followed by a potential retest of ATH.

Turbo (TURBO)
Similar to SPX, TURBO has also formed an ascending broadening wedge pattern, and the latest correction began after rejection from the upper trendline at $0.01445 (All-Time High) on December 11, triggering a sharp decline toward the lower support trendline.

With this drop, TURBO tested the lower trendline support at $0.0018 and has since managed to bounce slightly, now trading around $0.0025 and testing the key resistance of its 50-day moving average (MA) at $0.0031.
A clear move above this level could confirm an uptrend, potentially pushing TURBO towards the $0.0056–$0.010 range, which could further lead it to retest its all-time high of $0.01445.
Final Thoughts
SPX and TURBO are currently at critical resistance levels, and their near-term price movements will depend on whether they can break above the 50-day moving average. A successful breakout could signal the beginning of a broader recovery, while rejection could result in further consolidation or another dip.
Traders should keep an eye on volume and price behavior near those resistance lines — breakouts could lead to some quick upside moves.

Disclaimer: This article is for informational purposes only and not financial advice. Always conduct your own research before investing in cryptocurrencies.

The opinions and market insights shared on CoinsProbe represent the views of individual authors based on prevailing market conditions at the time of publication. Cryptocurrency investments carry significant risk and volatility. Readers are encouraged to conduct their own research and seek professional financial advice before making investment decisions. CoinsProbe and its contributors do not accept responsibility for financial losses or decisions made based on published content.
CoinsProbe may publish sponsored articles, affiliate links, or promotional collaborations. All sponsored material is clearly labeled to maintain transparency with our audience. Our editorial decisions remain fully independent, and advertising partnerships do not influence reviews, rankings, or published opinions.
Since 2023, CoinsProbe has delivered reliable insights on cryptocurrency, blockchain, and digital assets. Our content is created by experienced researchers and analysts who follow strict editorial standards focused on accuracy, transparency, and credibility. Every article is carefully reviewed and verified using trusted sources and current market data. We provide unbiased analysis and timely updates covering everything from emerging crypto projects to major industry developments.