
Date: Fri, March 14, 2025 | 09:10 AM GMT
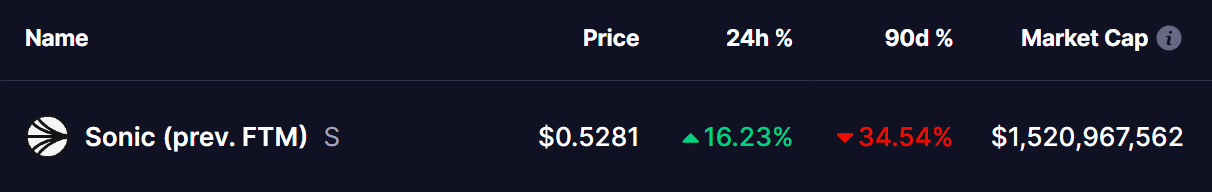
The cryptocurrency market is showing signs of stabilization after a prolonged downtrend that began following the late 2024 rallies. Sonic (S) has emerged as a standout performer in this potential rebound, surging 16% after bouncing from a critical support level.
The price action suggests that a bullish reversal could be underway, helping Sonic (S) recover from its 34% decline over the past 90 days.
Double Bottom Pattern: A Strong Reversal Signal?
The daily chart of Sonic (S) reveals a double bottom pattern, a well-known bullish reversal structure that often signals the end of a downtrend and the start of a new upward trend. This formation occurs when the price tests a key support level twice, failing to break lower, and then begins moving higher—a strong indication that sellers are losing control.
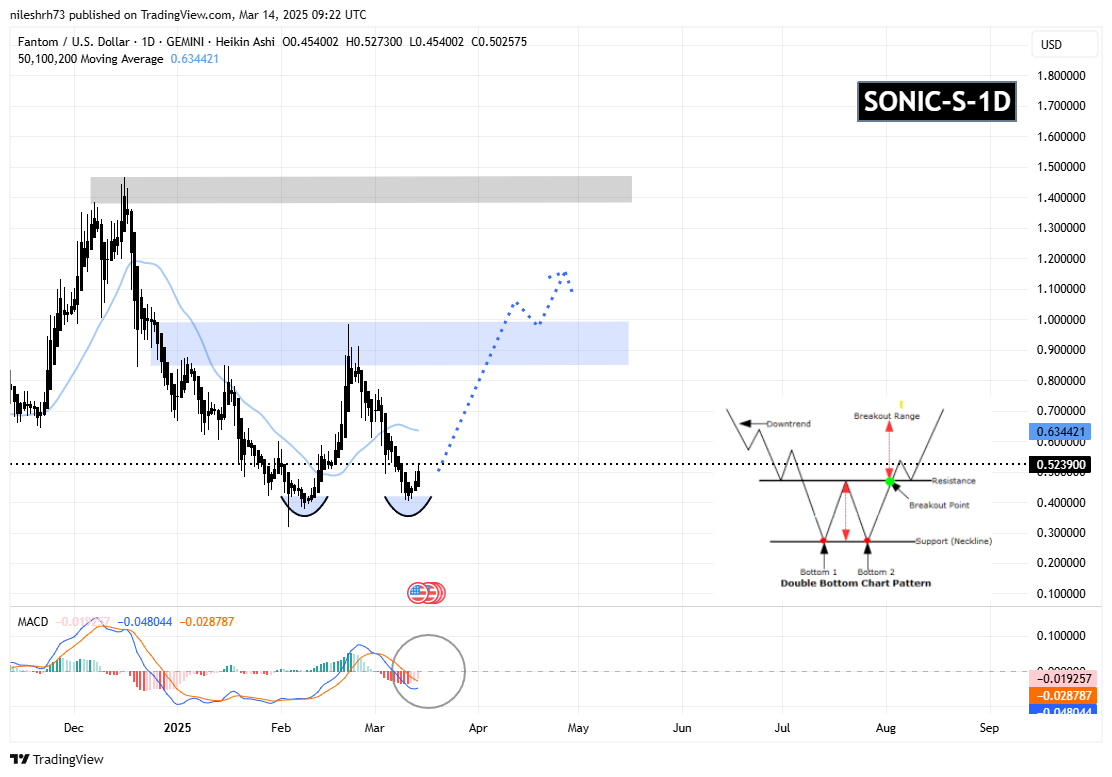
Recently, Sonic (S) faced rejection at its neckline resistance of $0.98, leading to a pullback toward the $0.40 support zone, which marked the second bottom of the pattern. However, this level held firm, and the price has now rebounded to $0.52, suggesting that buyers are stepping back in.
Adding to this bullish outlook, the MACD (Moving Average Convergence Divergence) indicator is displaying early signs of a bullish crossover, which historically signals a shift in momentum in favor of the buyers. If this pattern plays out as expected, Sonic (S) could attempt to reclaim the $0.98 neckline resistance in the near term. A successful breakout above this level could trigger a strong upward rally toward the next major resistance zone at $1.38–$1.46, representing an impressive potential gain of 178% from the current price.

Will This Pattern Confirm a Full Recovery?
With Sonic (S) rebounding strongly from a key support level, the double bottom pattern is gaining momentum. However, for this structure to confirm a full trend reversal, the price must decisively break above the $0.98 neckline resistance with strong volume support.
Disclaimer: This article is for informational purposes only and does not constitute financial advice. Always conduct your own research before making any investment decisions in cryptocurrencies.

The opinions and market insights shared on CoinsProbe represent the views of individual authors based on prevailing market conditions at the time of publication. Cryptocurrency investments carry significant risk and volatility. Readers are encouraged to conduct their own research and seek professional financial advice before making investment decisions. CoinsProbe and its contributors do not accept responsibility for financial losses or decisions made based on published content.
CoinsProbe may publish sponsored articles, affiliate links, or promotional collaborations. All sponsored material is clearly labeled to maintain transparency with our audience. Our editorial decisions remain fully independent, and advertising partnerships do not influence reviews, rankings, or published opinions.
Since 2023, CoinsProbe has delivered reliable insights on cryptocurrency, blockchain, and digital assets. Our content is created by experienced researchers and analysts who follow strict editorial standards focused on accuracy, transparency, and credibility. Every article is carefully reviewed and verified using trusted sources and current market data. We provide unbiased analysis and timely updates covering everything from emerging crypto projects to major industry developments.