Date: Sun, Dec 22, 2024, 04:08 AM GMT
The cryptocurrency market is turbulent this week, with Bitcoin (BTC) suffering a sharp dip since December 17, pushing it to a low of $92,000 before recovering slightly to its current trading price of $97,000. Amid this correction, top altcoins like Solana (SOL) and Chainlink (LINK) have also faced significant declines. Both are trading in the red today and are now testing key support levels.

Both assets are now testing critical support levels, raising the question of whether a rebound is on the horizon.
Solana (SOL)
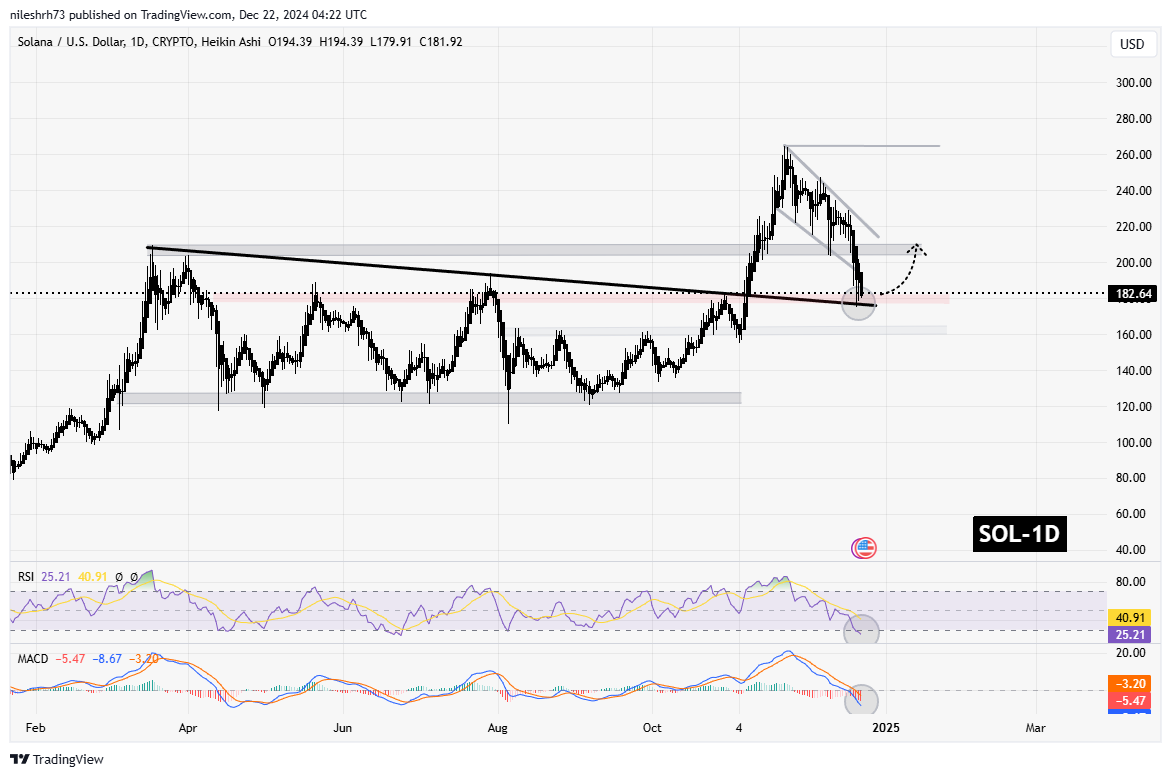
Solana (SOL) has seen a substantial decline, dropping from $226 on December 17 to its current price of $182—a correction of nearly 19%. The price is now testing a crucial confluence zone, consisting of a descending resistance trendline and a horizontal support zone between $177 and $190. This area previously served as strong resistance from March to November.

Technical indicators suggest that SOL may be nearing a potential reversal. Both the RSI (Relative Strength Index) and MACD (Moving Average Convergence Divergence) appear to be bottoming out, signaling oversold conditions. A successful rebound from this level could see SOL retest its next major resistance at $210.
However, if the current support level fails to hold, SOL could slide further to its next significant support zone around $162, a level that previously acted as a strong floor during earlier corrections.
Chainlink (LINK)
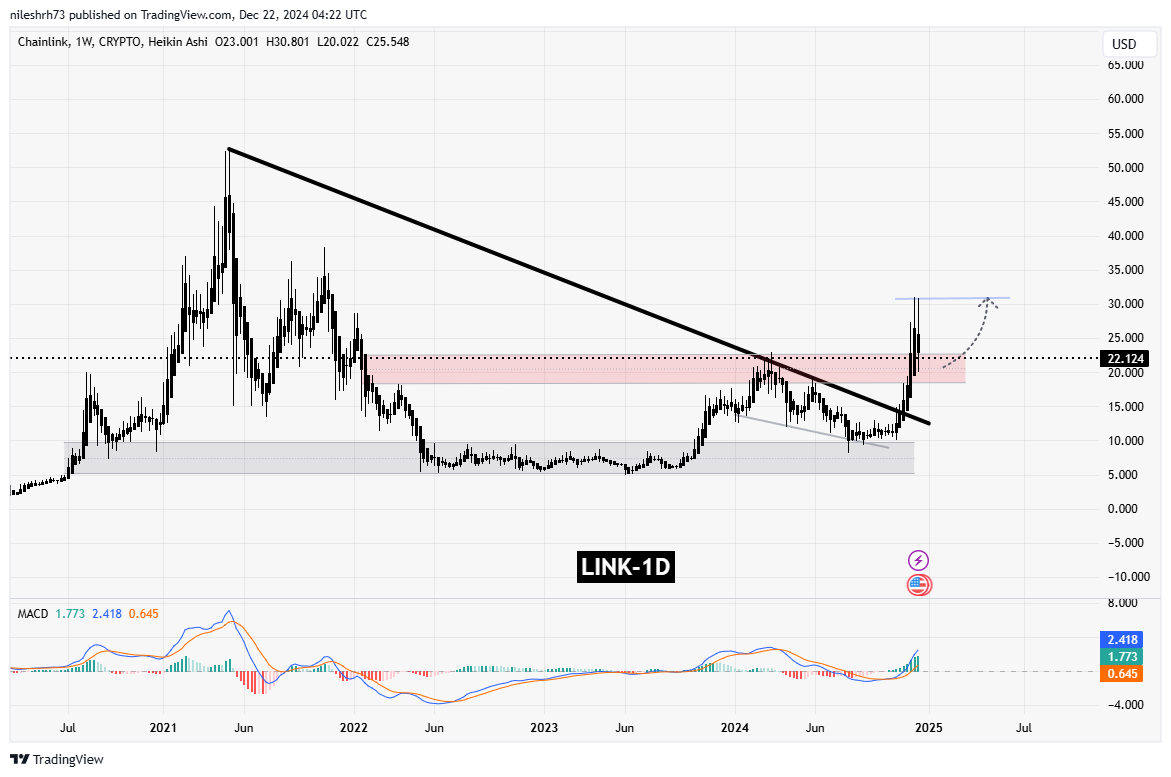
Chainlink (LINK) has also experienced a sharp pullback, dropping approximately 23% from its 17 Dec’s high of $28 to its current price of $22.15. This decline coincides with a retest of LINK’s previous breakout zone. Notably, LINK had recently managed to break above the $18.39–$22.52 resistance range, propelling it to a high of $30.80.

The current pullback has brought LINK back into this key support zone, which now serves as a make-or-break level for the asset. If buyers successfully defend this level, LINK could stage a recovery and aim for a retest of its recent high at $30.80.
The MACD indicator for LINK is showing early signs of bullish divergence, suggesting that momentum could shift in favor of the bulls.
Is A Rebound Ahead?
While both SOL and LINK are at crucial support levels, and a rebound could be on the horizon. The technical setups for both tokens point to the possibility of upward momentum, especially if Bitcoin maintains its recovery above $97,000. However, the broader market sentiment remains mixed, and the performance of Bitcoin will play a critical role in determining the trajectory of these altcoins.
While the signs are promising, traders should remain cautious and closely monitor market conditions for further developments. The potential upside for SOL and LINK is significant, but broader market trends will likely dictate the pace and extent of any rally.
Disclaimer: This article is for informational purposes only and not financial advice. Always conduct your own research before investing in cryptocurrencies.


