
Date: Mon, Dec 08, 2025 | 06:36 PM GMT
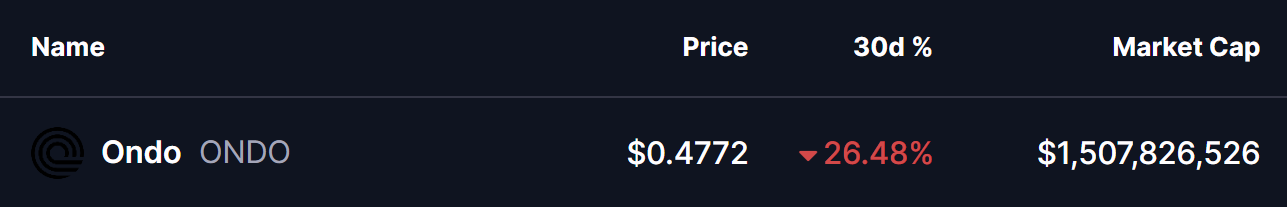
The broader crypto market remains under pressure, with Ethereum (ETH) shedding nearly 8% over the past 30 days. This weakness has spilled over into altcoins, and the RWA-focused token Ondo (ONDO) has not been spared — posting a sharp decline of more than 26% in the same period.
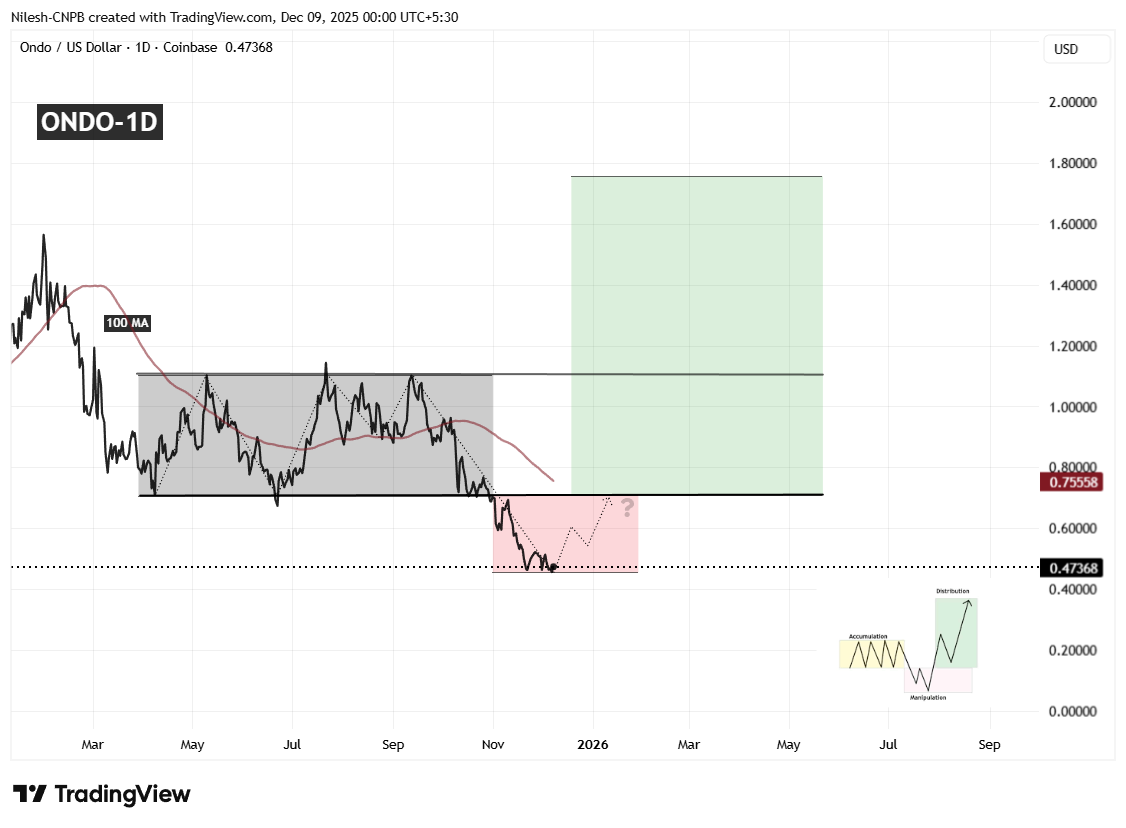
Despite the heavy selling, ONDO’s daily chart is beginning to hint at something more constructive. The structure currently forming aligns closely with a classic “Power of 3” setup — a market pattern that often appears before strong trend reversals.
Accumulation Phase
For several months, ONDO traded in a tight sideways range between $1.1050 as resistance and $0.7095 as support. This long period of consolidation suggested quiet accumulation, with smart money building positions while price volatility steadily contracted.
This phase built a strong base, but also created a clear range that the market later used as a liquidity target.
Manipulation Phase
In early November, ONDO broke decisively below the key $0.7095 support level. This breakdown triggered stops and forced weak hands out of the market. Price dropped to a local low near $0.4550, before stabilizing around the $0.4760–$0.4800 region.
This red-shaded area on the chart represents the manipulation zone — where false breakdowns often occur before a true trend direction is revealed.
What Comes Next?
Right now, ONDO remains inside this manipulation zone, which means some sideways chop or minor downside is still possible. However, if buyers continue to defend this region and price reclaims $0.7095, the next phase — expansion — could begin.
Key technical levels to watch:
- Immediate resistance: 100-day MA near $0.7556
- Major breakout zone: $1.1050
A clean break above both of these levels could open the door toward the projected target near $1.75, representing significant upside potential from current prices.
Final Thoughts
While the structure is slowly turning constructive, ONDO remains vulnerable as long as it trades below $0.7095. Bulls need to reclaim this level to confirm any serious shift in trend. Until then, caution remains justified, but the technical foundation for a recovery is clearly starting to form.
Disclaimer: The views and analysis presented in this article are for informational purposes only and reflect the author’s perspective, not financial advice. Technical patterns and indicators discussed are subject to market volatility and may or may not yield the anticipated results. Investors are advised to exercise caution, conduct independent research, and make decisions aligned with their individual risk tolerance.

The opinions and market insights shared on CoinsProbe represent the views of individual authors based on prevailing market conditions at the time of publication. Cryptocurrency investments carry significant risk and volatility. Readers are encouraged to conduct their own research and seek professional financial advice before making investment decisions. CoinsProbe and its contributors do not accept responsibility for financial losses or decisions made based on published content.
CoinsProbe may publish sponsored articles, affiliate links, or promotional collaborations. All sponsored material is clearly labeled to maintain transparency with our audience. Our editorial decisions remain fully independent, and advertising partnerships do not influence reviews, rankings, or published opinions.
Since 2023, CoinsProbe has delivered reliable insights on cryptocurrency, blockchain, and digital assets. Our content is created by experienced researchers and analysts who follow strict editorial standards focused on accuracy, transparency, and credibility. Every article is carefully reviewed and verified using trusted sources and current market data. We provide unbiased analysis and timely updates covering everything from emerging crypto projects to major industry developments.