

Date: Tue, Jan 06, 2026 | 10:08 AM GMT
The broader cryptocurrency market continues to show fresh strength at the start of the new year. Both Bitcoin (BTC) and Ethereum (ETH) are posting weekly gains of over 6%, helping restore confidence across the market. This improving sentiment is now spilling over into major altcoins — including Jupiter (JUP).
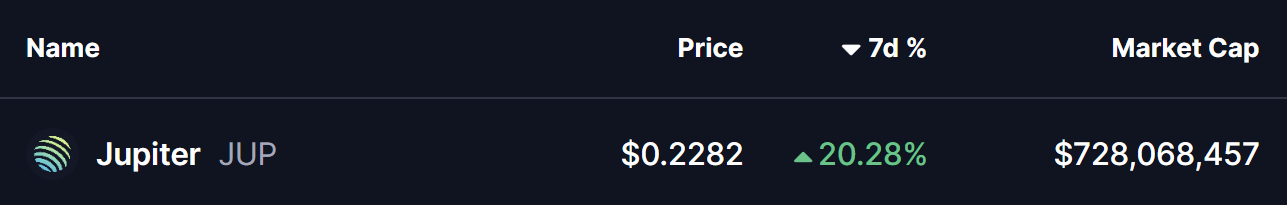
JUP has already delivered an impressive 20% gain on the week. While the short-term momentum is encouraging, the more important development is unfolding on the higher-timeframe chart. Recent price action suggests a meaningful shift in market behavior, hinting that JUP could be transitioning from a corrective phase into a broader bullish continuation if key resistance zones are reclaimed.
Rounding Bottom Formation Taking Shape
On the daily chart, Jupiter appears to be forming a rounding bottom pattern — a classic bullish reversal structure that typically develops after extended downside pressure and gradual seller exhaustion.
This setup began after JUP faced a strong rejection from the $0.4540–$0.4760 resistance zone in late October. That rejection triggered a sharp sell-off, dragging price lower toward the $0.17 region. However, bears failed to maintain control beyond that point. Selling pressure faded, demand began to absorb supply, and price started stabilizing.
Over time, volatility compressed and JUP began curling higher in a smooth, rounded fashion — closely matching the textbook behavior of a developing rounding bottom. Importantly, the recent recovery has pushed price back above the 50-day moving average around $0.2192, a level that previously capped upside attempts and now appears to be turning into support.
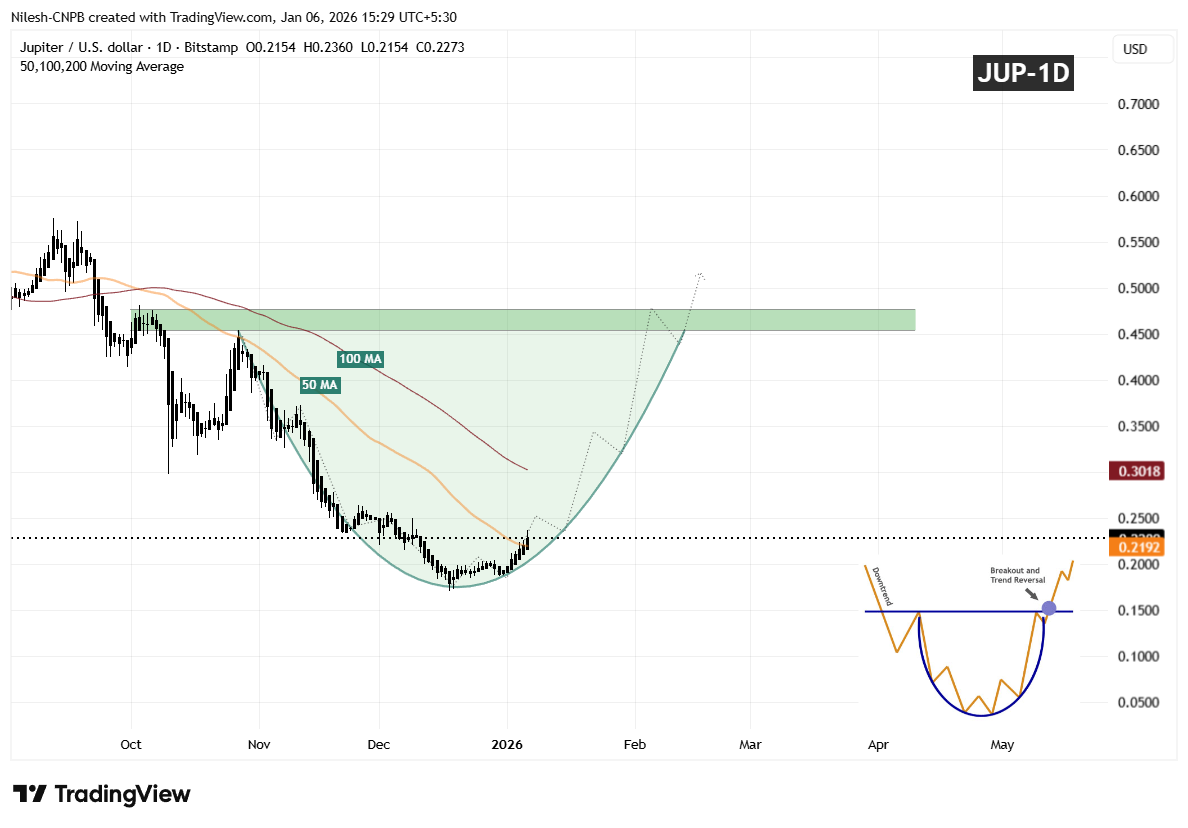
The gradual slope of the recovery suggests organic accumulation rather than speculative spikes, reinforcing the credibility of the developing base.
What’s Next for JUP?
If JUP continues to hold above the 50-day moving average, this level could serve as a solid foundation for further upside, with the 100-day moving average acting as the next upside magnet in the near term.
A clean and decisive breakout above the $0.4540–$0.4760 resistance zone, followed by sustained acceptance above that area, would confirm the rounding bottom reversal and likely open the door for a broader bullish expansion phase.
Until that breakout occurs, the pattern remains in development. Some short-term consolidation or shallow pullbacks are possible as price digests recent gains. However, as long as JUP continues to print higher lows above the established base, the broader structure remains constructive.
For now, the chart suggests Jupiter is approaching a critical confirmation phase — one that could determine whether this recovery matures into a sustained bullish trend as 2026 progresses.
Disclaimer: The views and analysis presented in this article are for informational purposes only and reflect the author’s perspective, not financial advice. Technical patterns and indicators discussed are subject to market volatility and may or may not yield the anticipated results. Investors are advised to exercise caution, conduct independent research, and make decisions aligned with their individual risk tolerance.
About Author: Nilesh Hembade is the Founder and Lead Author of Coinsprobe, with over 5 years of experience in the cryptocurrency and blockchain industry. Since launching Coinsprobe in 2023, he has been providing daily, research-driven insights through in-depth market analysis, on-chain data, and technical research.

The opinions and market insights shared on CoinsProbe represent the views of individual authors based on prevailing market conditions at the time of publication. Cryptocurrency investments carry significant risk and volatility. Readers are encouraged to conduct their own research and seek professional financial advice before making investment decisions. CoinsProbe and its contributors do not accept responsibility for financial losses or decisions made based on published content.
CoinsProbe may publish sponsored articles, affiliate links, or promotional collaborations. All sponsored material is clearly labeled to maintain transparency with our audience. Our editorial decisions remain fully independent, and advertising partnerships do not influence reviews, rankings, or published opinions.
Since 2023, CoinsProbe has delivered reliable insights on cryptocurrency, blockchain, and digital assets. Our content is created by experienced researchers and analysts who follow strict editorial standards focused on accuracy, transparency, and credibility. Every article is carefully reviewed and verified using trusted sources and current market data. We provide unbiased analysis and timely updates covering everything from emerging crypto projects to major industry developments.