
Date: Fri, Dec 19 2025 | 12:15 PM GMT
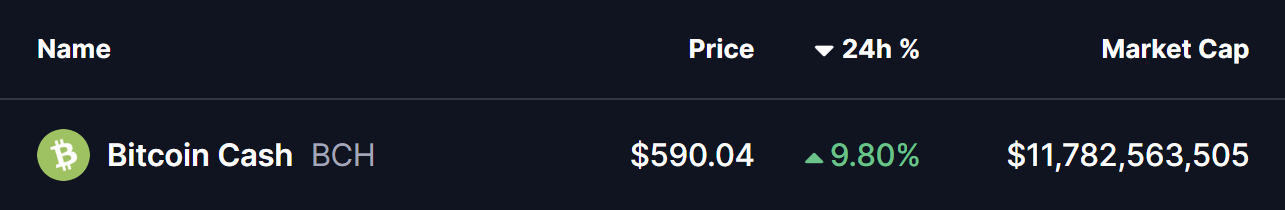
The broader cryptocurrency market has been showing relative strength despite concerns around the Japan rate hike, while easing U.S. inflation has helped both Bitcoin (BTC) and Ethereum (ETH) remain in the green. Against this backdrop, Bitcoin Cash (BCH) has quietly moved into the spotlight, posting a notable upside move.
BCH has climbed nearly 9% recently, but the bigger story appears to be unfolding on the chart itself. Price action is now forming a structure that often precedes larger trend reversals, suggesting that the recent rally may be more than just a short-term bounce.
Rounding Bottom in Play?
On the daily timeframe, Bitcoin Cash appears to be carving out a rounding bottom formation — a classic bullish reversal pattern that reflects a gradual shift from distribution to accumulation. This pattern typically develops after a prolonged correction, as selling pressure fades and buyers slowly regain control.
The setup began after BCH faced a firm rejection near the $630 region in September 2025. That rejection triggered a sharp decline, dragging price down toward the $446.9 area. Importantly, sellers failed to push price significantly lower from there, and strong demand emerged at those levels. Over time, BCH stabilized, volatility compressed, and price began to curl higher, completing the rounded base structure.
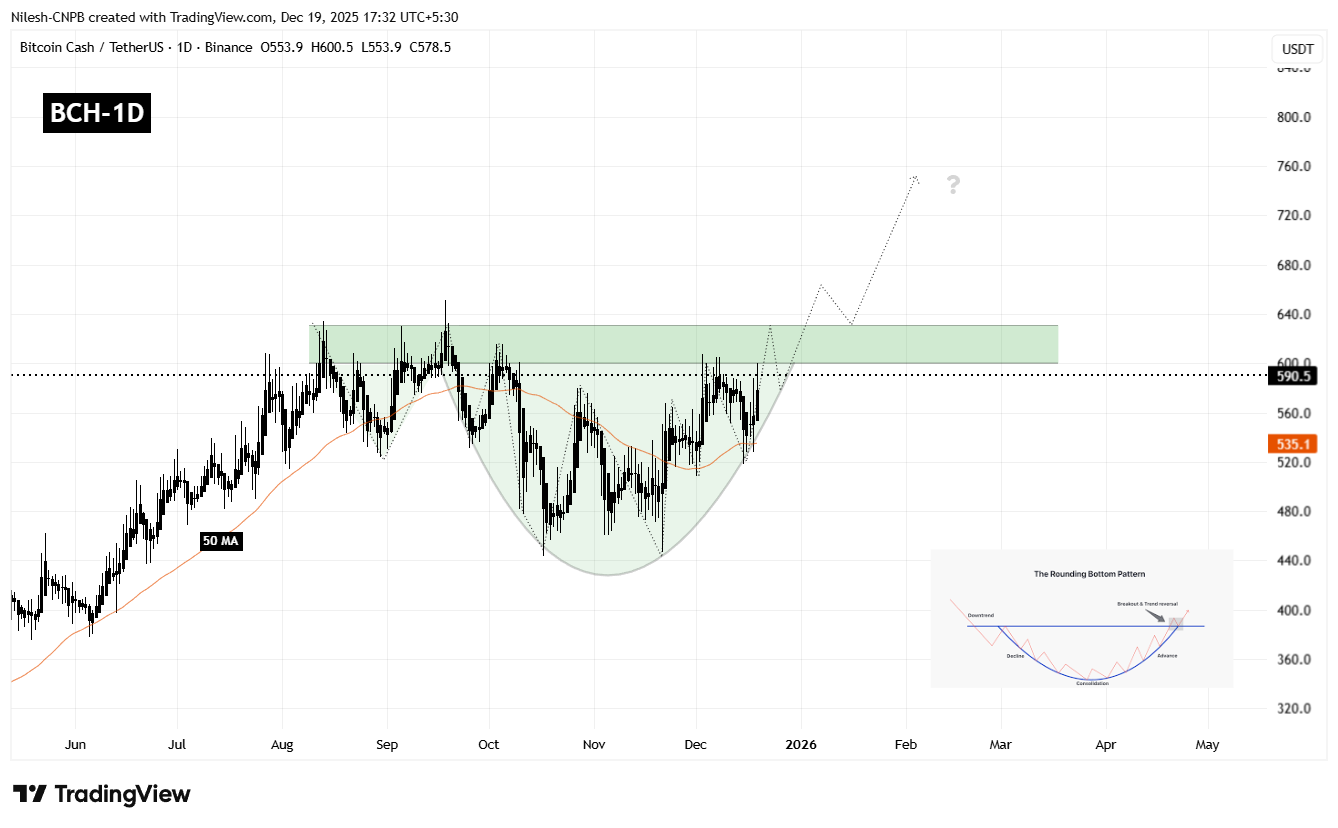
Currently, BCH is trading around the $590 mark and pressing up against a well-defined resistance zone between $600 and $630. This area represents the neckline of the rounding bottom pattern and has capped price advances multiple times in the past, making it the most critical level to watch in the near term.
What’s Next for BCH?
A clean daily close above the $600–$630 resistance zone would confirm the bullish rounding bottom breakout. If that breakout is followed by a successful retest of the same zone as support, it would significantly strengthen the bullish case and suggest that a new upward leg is underway.
Based on the depth of the rounding structure, the projected upside target points toward the $800–$820 region. Reaching that zone would imply a potential upside of roughly 35–40% from current levels, aligning with the measured move typically associated with this pattern.
However, patience remains important. Before any confirmed breakout, BCH could still experience short-term pullbacks, including a dip toward the rising base of the rounding structure or the 50-day moving average, which has been acting as dynamic support during the recovery. Such pullbacks would not necessarily invalidate the bullish setup, as long as price continues to hold above the higher low structure.
Until a decisive breakout and retest occur, traders may want to remain cautious and avoid chasing price. The $600–$630 zone remains the line in the sand that will determine whether BCH transitions into a sustained bullish phase or remains range-bound for longer.
Disclaimer: The views and analysis presented in this article are for informational purposes only and reflect the author’s perspective, not financial advice. Technical patterns and indicators discussed are subject to market volatility and may or may not yield the anticipated results. Investors are advised to exercise caution, conduct independent research, and make decisions aligned with their individual risk tolerance.

The opinions and market insights shared on CoinsProbe represent the views of individual authors based on prevailing market conditions at the time of publication. Cryptocurrency investments carry significant risk and volatility. Readers are encouraged to conduct their own research and seek professional financial advice before making investment decisions. CoinsProbe and its contributors do not accept responsibility for financial losses or decisions made based on published content.
CoinsProbe may publish sponsored articles, affiliate links, or promotional collaborations. All sponsored material is clearly labeled to maintain transparency with our audience. Our editorial decisions remain fully independent, and advertising partnerships do not influence reviews, rankings, or published opinions.
Since 2023, CoinsProbe has delivered reliable insights on cryptocurrency, blockchain, and digital assets. Our content is created by experienced researchers and analysts who follow strict editorial standards focused on accuracy, transparency, and credibility. Every article is carefully reviewed and verified using trusted sources and current market data. We provide unbiased analysis and timely updates covering everything from emerging crypto projects to major industry developments.