
Date: Fri, Jan 02, 2026 | 10:54 AM GMT
The broader cryptocurrency market has started the new year with modest strength, as both Bitcoin (BTC) and Ethereum (ETH) trade slightly higher with gains of over 2%. This renewed stability across majors has helped improve overall sentiment, allowing several altcoins to regain momentum — including Aster (ASTER).
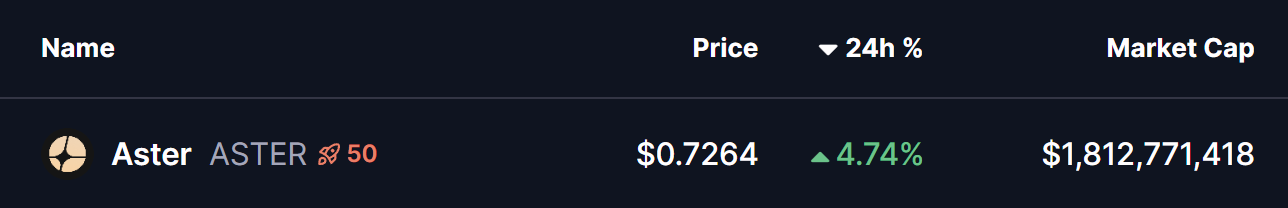
ASTER is currently trading around 4% higher on the day, but the more important development lies beneath the surface. On lower timeframes, price action is beginning to highlight a constructive bullish structure, suggesting that the token may be preparing for a meaningful breakout if the setup confirms.
Ascending Triangle Structure Takes Shape
On the 4-hour chart, ASTER is forming a clear ascending triangle, defined by a series of higher lows pressing steadily against a horizontal resistance zone. This type of structure is widely regarded as a bullish continuation pattern, particularly when it develops during consolidation and shows consistent buyer accumulation at rising support levels.
ASTER recently faced rejection near the $0.7367 neckline resistance, which pushed price back toward its ascending support trendline around the $0.68 region. Importantly, each dip has been met with strong buying interest, preventing any deeper pullback and keeping the bullish structure intact. This behavior indicates that sellers are gradually losing control as buyers step in earlier on every retracement.
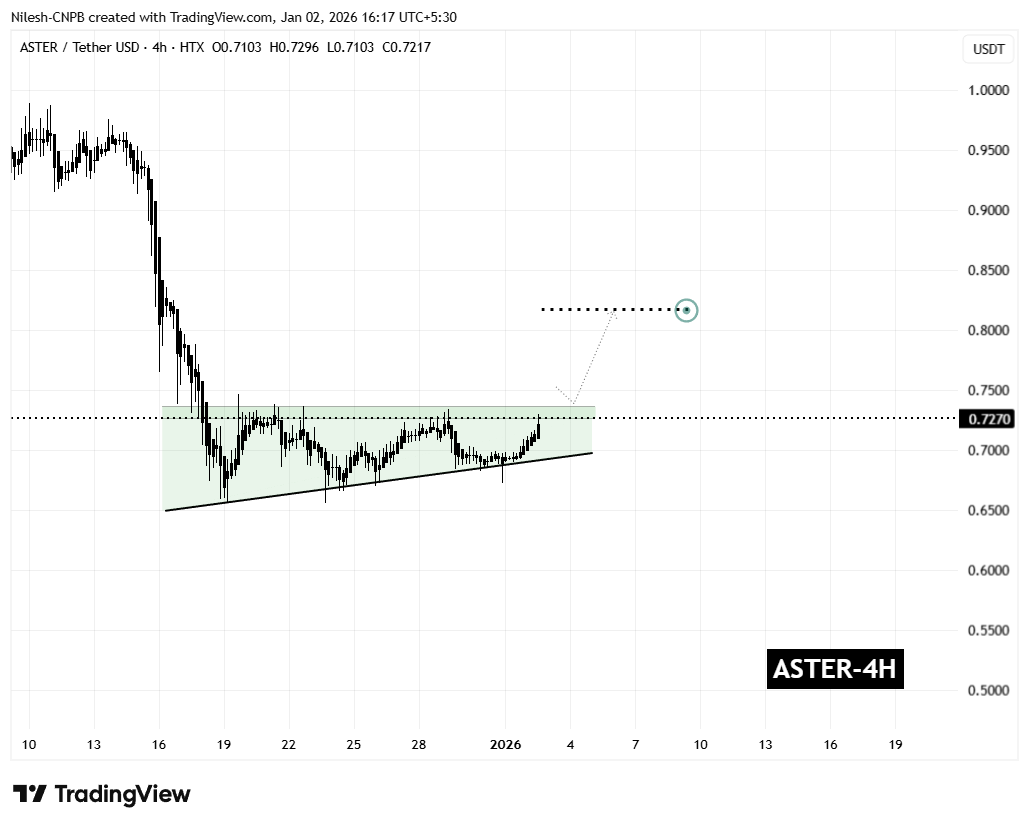
The latest rebound has once again carried ASTER toward the upper boundary of the triangle, reinforcing the idea that demand remains firm. Rather than signaling weakness, this sideways-to-higher price action reflects healthy consolidation as volatility tightens ahead of a potential breakout.
What’s Next for ASTER?
From here, ASTER appears to be preparing for another test of the $0.7367 resistance zone. A decisive breakout above this level, followed by a sustained close and a successful retest as support, would confirm the ascending triangle pattern and likely trigger a bullish expansion phase.
Based on the measured move of the formation, the technical upside projection points toward the $0.8178 region. This target represents a potential upside of roughly 12% from current levels and also aligns with previous price structure, adding further confidence to the bullish outlook.
That said, caution remains warranted. If ASTER fails to break above resistance, price could once again drift back toward the rising support trendline. As long as this trendline continues to hold, the broader bullish setup remains valid. A decisive breakdown below support, however, would invalidate the pattern and postpone any breakout scenario.
For now, the combination of improving market sentiment, consistent dip-buying, and a tightening ascending triangle structure suggests that Aster is approaching a critical decision point — one that could define its next significant move as 2026 begins.
Disclaimer: The views and analysis presented in this article are for informational purposes only and reflect the author’s perspective, not financial advice. Technical patterns and indicators discussed are subject to market volatility and may or may not yield the anticipated results. Investors are advised to exercise caution, conduct independent research, and make decisions aligned with their individual risk tolerance.
About Author: Nilesh Hembade is the Founder and Lead Author of Coinsprobe, with over 5 years of experience in the cryptocurrency and blockchain industry. Since launching Coinsprobe in 2023, he has been providing daily, research-driven insights through in-depth market analysis, on-chain data, and technical research.

The opinions and market insights shared on CoinsProbe represent the views of individual authors based on prevailing market conditions at the time of publication. Cryptocurrency investments carry significant risk and volatility. Readers are encouraged to conduct their own research and seek professional financial advice before making investment decisions. CoinsProbe and its contributors do not accept responsibility for financial losses or decisions made based on published content.
CoinsProbe may publish sponsored articles, affiliate links, or promotional collaborations. All sponsored material is clearly labeled to maintain transparency with our audience. Our editorial decisions remain fully independent, and advertising partnerships do not influence reviews, rankings, or published opinions.
Since 2023, CoinsProbe has delivered reliable insights on cryptocurrency, blockchain, and digital assets. Our content is created by experienced researchers and analysts who follow strict editorial standards focused on accuracy, transparency, and credibility. Every article is carefully reviewed and verified using trusted sources and current market data. We provide unbiased analysis and timely updates covering everything from emerging crypto projects to major industry developments.