

Key Takeaways
- AAVE is trading near $173 after a healthy pullback, while still maintaining a strong weekly uptrend.
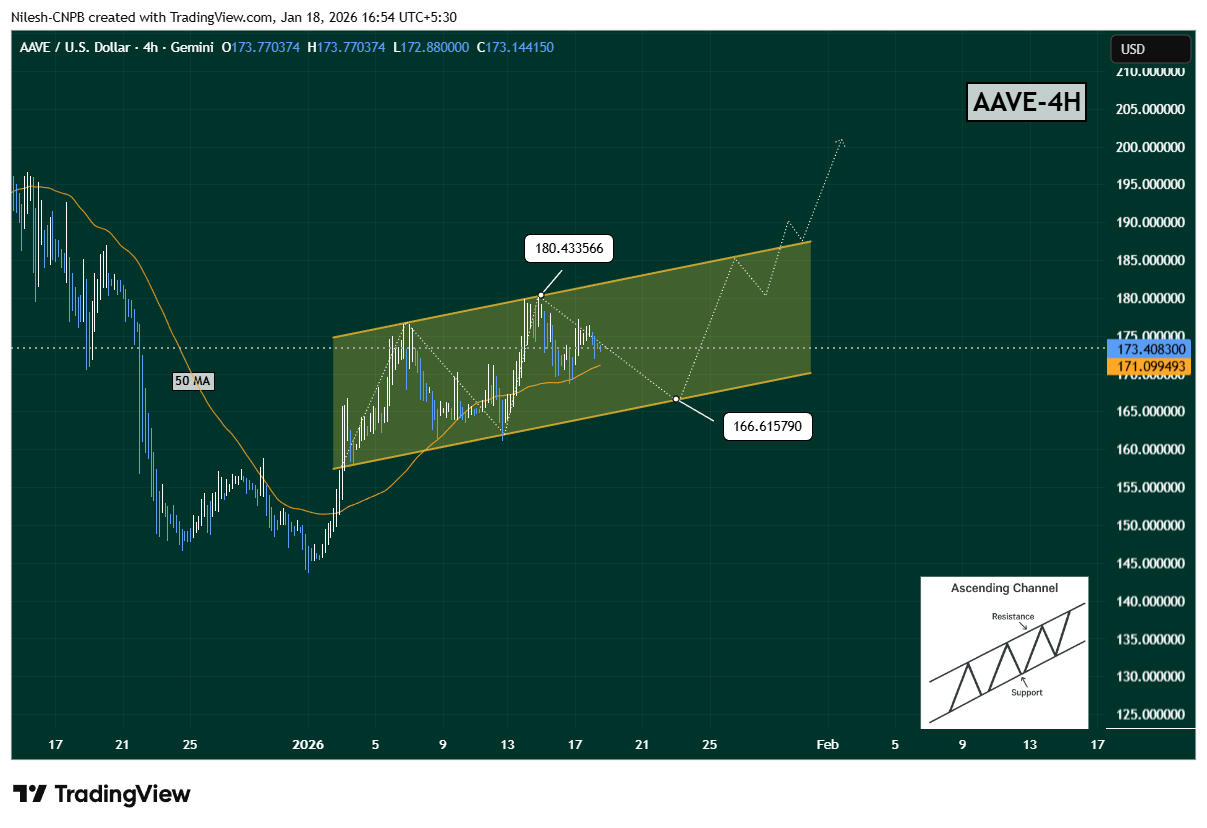
- The 4-hour chart shows a clear ascending channel, signaling sustained bullish structure.
- The 50-period moving average around $171 is acting as key short-term support.
- A breakdown below support could lead to a dip toward $166, still within bullish structure.
- A confirmed breakout above $180–$186 may open the door for a move toward $200+.
As of January 18, 2026, Aave (AAVE) is trading around $173.34, posting a mild 0.97% dip over the last 24 hours. Despite the short-term pullback, the broader picture remains constructive, with AAVE still up 4.22% over the past week. This steady recovery signals renewed buyer interest after a prolonged consolidation phase, keeping Aave firmly in focus among top DeFi tokens.
With a market capitalization near $2.65 billion, Aave continues to stand out as one of the most resilient decentralized lending protocols. More importantly, the chart structure is now hinting that a larger move could be brewing beneath the surface.

Ascending Channel Structure Emerges
On the 4-hour timeframe, AAVE is respecting a well-defined ascending channel, a bullish pattern characterized by a sequence of higher highs and higher lows. Price action has consistently bounced from the lower boundary of the channel, indicating that buyers are stepping in on dips rather than waiting for deeper pullbacks.
Recently, AAVE faced rejection near the upper boundary around $180.43, triggering a short-term retracement. The pullback, however, has been orderly rather than impulsive, with price now hovering just above the 50-period moving average near $171.09, which is acting as immediate dynamic support.
This behavior suggests healthy consolidation rather than trend exhaustion, keeping the bullish channel structure intact for now.
What’s Next for AAVE?
If AAVE fails to hold the 50 MA, the next likely downside test sits near the lower boundary of the ascending channel around $166.61, representing a potential 4% downside from current levels. A move into this zone would still be considered a normal corrective pullback within the broader bullish structure.
Then a strong bounce from channel support could send AAVE back toward the upper boundary around $180–$186 resistance zone. A clean breakout above this region would signal strength returning to buyers and could open the door for an accelerated move toward the psychological $200 level and beyond.
That said, patience is key. A confirmed breakout above channel resistance would provide much stronger validation than anticipation alone.
Bottom Line
Aave is quietly building a bullish continuation setup after months of sideways action. The ascending channel on the 4-hour chart highlights steady accumulation, with buyers defending key support levels.
If AAVE rebounds from channel support, a retest of $180–$186 looks likely — and a breakout there could quickly shift momentum toward the $200+ zone. Until then, the current consolidation remains a critical phase that could define AAVE’s next major move.
All eyes are now on how price reacts around support — because the next bounce may determine whether bulls take full control heading into next week.
Disclaimer: The views and analysis presented in this article are for informational purposes only and reflect the author’s perspective, not financial advice. Technical patterns and indicators discussed are subject to market volatility and may or may not yield the anticipated results. Investors are advised to exercise caution, conduct independent research, and make decisions aligned with their individual risk tolerance.
About Author: Nilesh Hembade is the Founder and Lead Author of Coinsprobe, with over 5 years of experience in the cryptocurrency and blockchain industry. Since launching Coinsprobe in 2023, he has been providing daily, research-driven insights through in-depth market analysis, on-chain data, and technical research.

The opinions and market insights shared on CoinsProbe represent the views of individual authors based on prevailing market conditions at the time of publication. Cryptocurrency investments carry significant risk and volatility. Readers are encouraged to conduct their own research and seek professional financial advice before making investment decisions. CoinsProbe and its contributors do not accept responsibility for financial losses or decisions made based on published content.
CoinsProbe may publish sponsored articles, affiliate links, or promotional collaborations. All sponsored material is clearly labeled to maintain transparency with our audience. Our editorial decisions remain fully independent, and advertising partnerships do not influence reviews, rankings, or published opinions.
Since 2023, CoinsProbe has delivered reliable insights on cryptocurrency, blockchain, and digital assets. Our content is created by experienced researchers and analysts who follow strict editorial standards focused on accuracy, transparency, and credibility. Every article is carefully reviewed and verified using trusted sources and current market data. We provide unbiased analysis and timely updates covering everything from emerging crypto projects to major industry developments.