
Date: Tue, Dec 02, 2025 | 03:40 PM GMT
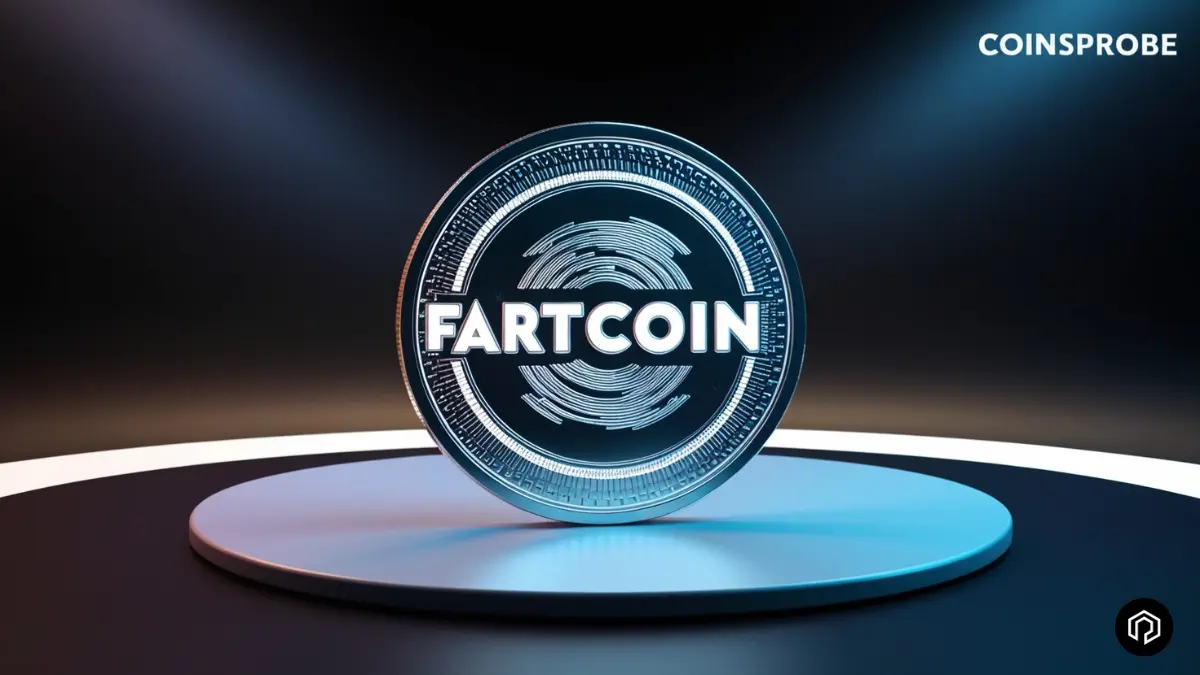
The broader cryptocurrency market is showing signs of a relief bounce following yesterday’s heavy selloff. Both Bitcoin (BTC) and Ethereum (ETH) have posted strong 8% 24-hour gains, helping several beaten-down memecoins recover, including Fartcoin (FARTCOIN).
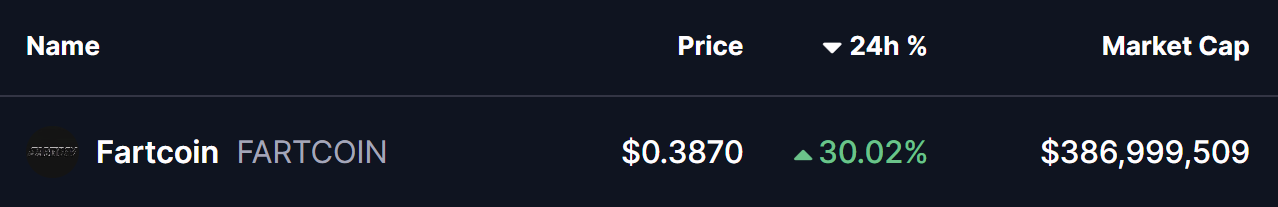
FARTCOIN has surged more than 30% today, but what makes this move particularly interesting is the emerging technical structure on its chart — one that could indicate a much larger upside move ahead.
Harmonic Pattern Hints at Potential Upside
On the daily chart, FARTCOIN appears to be completing a Bullish Shark harmonic pattern, a formation often associated with strong reversal phases when price exhausts its downside momentum.
The pattern began with the initial O-X impulse around $0.1990, followed by a sharp rise to point X near $1.055. Price then retraced toward point A, climbed again to form point B around $1.691, and has since declined steadily into point C, forming near the $0.17–$0.18 range.
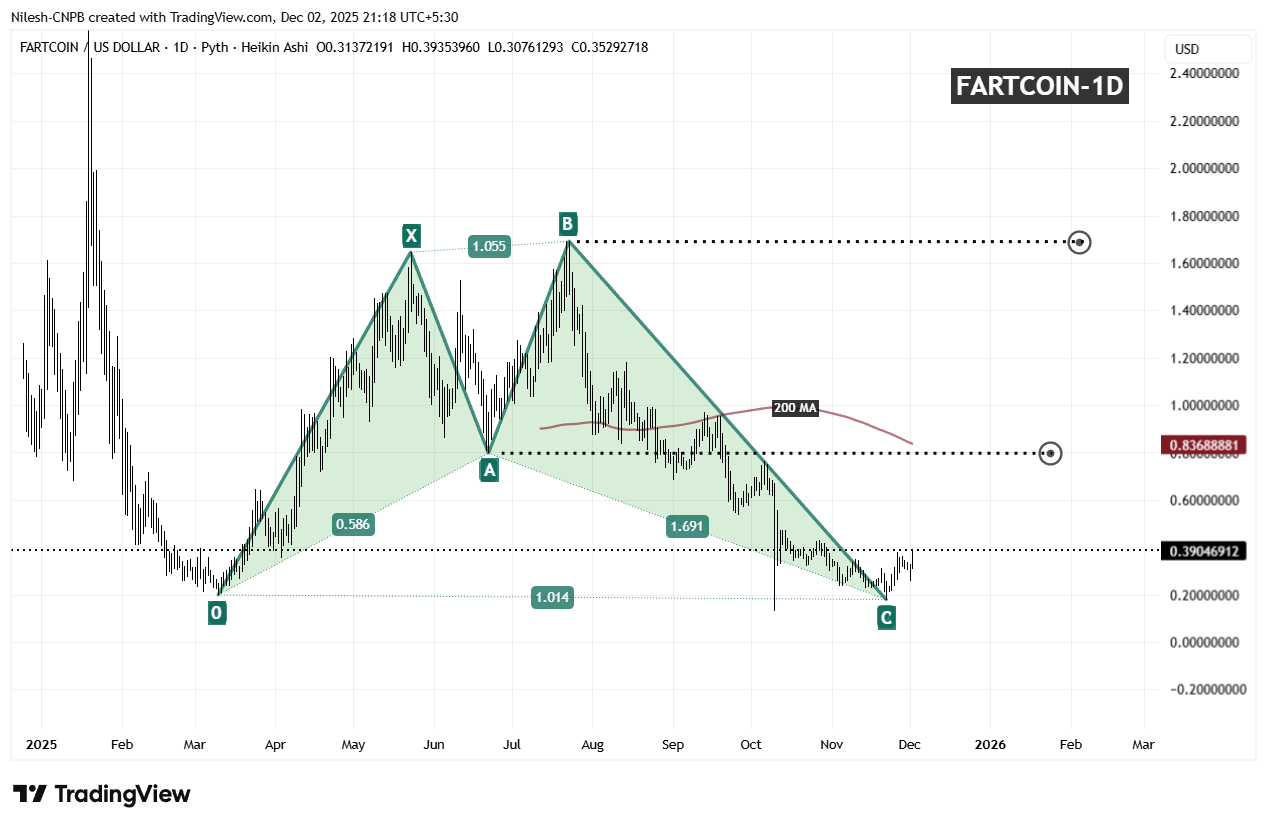
This C-leg completion is crucial, as it typically marks the reversal zone for a Shark pattern. And right on cue, buyers have stepped back in, pushing FARTCOIN higher and establishing early signs of recovery. The token now trades around $0.3904, showing renewed strength off its harmonic support zone.
What’s Next for FARTCOIN?
If this harmonic structure continues to play out as expected, FARTCOIN may be gearing up for a more extended upside move. The first major level to watch sits near $0.83, which aligns with a previous supply zone as well as the 200-day moving average. A breakout above this zone could open the doors for a larger upside target around the $1.69 region — the same area where the B-leg previously peaked.
However, failure to hold above the C-leg region could invalidate the harmonic setup and expose the price to a deeper pullback. For now, though, the pattern remains intact, and momentum is beginning to shift back in favor of the bulls.
Disclaimer: The views and analysis presented in this article are for informational purposes only and reflect the author’s perspective, not financial advice. Technical patterns and indicators discussed are subject to market volatility and may or may not yield the anticipated results. Investors are advised to exercise caution, conduct independent research, and make decisions aligned with their individual risk tolerance.

The opinions and market insights shared on CoinsProbe represent the views of individual authors based on prevailing market conditions at the time of publication. Cryptocurrency investments carry significant risk and volatility. Readers are encouraged to conduct their own research and seek professional financial advice before making investment decisions. CoinsProbe and its contributors do not accept responsibility for financial losses or decisions made based on published content.
CoinsProbe may publish sponsored articles, affiliate links, or promotional collaborations. All sponsored material is clearly labeled to maintain transparency with our audience. Our editorial decisions remain fully independent, and advertising partnerships do not influence reviews, rankings, or published opinions.
Since 2023, CoinsProbe has delivered reliable insights on cryptocurrency, blockchain, and digital assets. Our content is created by experienced researchers and analysts who follow strict editorial standards focused on accuracy, transparency, and credibility. Every article is carefully reviewed and verified using trusted sources and current market data. We provide unbiased analysis and timely updates covering everything from emerging crypto projects to major industry developments.