
Key Takeaways
- Ethereum witnessed a massive $1.14 billion liquidation event, with longs accounting for the majority of forced closures.
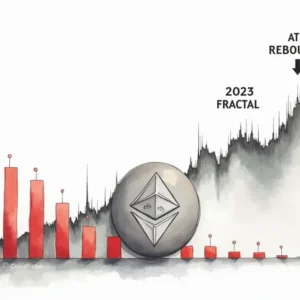
- ETH price broke down from its $2,620 accumulation zone, triggering a sharp manipulation move toward yearly lows.
- The current structure aligns with a potential Power of 3 (PO3) setup on the higher timeframe.
- A dip toward $2,128 support could act as a final shakeout before a possible trend reversal.
- Reclaiming $2,620 would be a key signal for bullish expansion, opening the door toward $4,500+ targets.
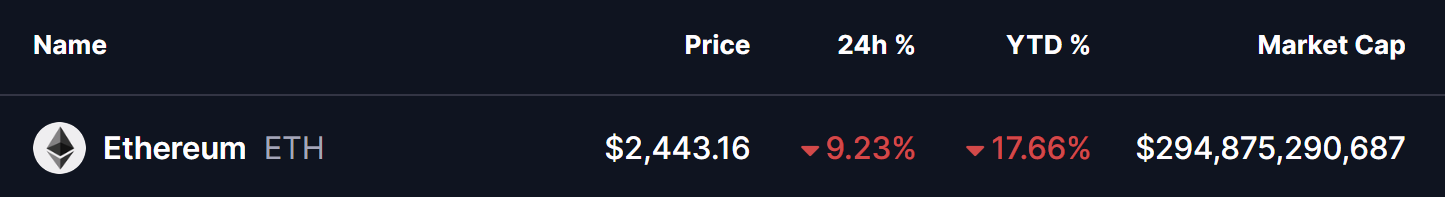
Ethereum ($ETH), the second-largest cryptocurrency by market capitalization, has failed to maintain its early-January recovery momentum. After topping out near $3,400, ETH saw aggressive selling pressure into the month-end. On January 31, 2026, price briefly dipped to a low of $2,247, marking a sharp 9.33% drop in just 24 hours and printing a fresh yearly low.
This sudden downside move caught many traders off-guard and triggered one of the largest liquidation events of the year so far.
Liquidations soar past $1.14 billion
According to data from Coinglass, Ethereum-related liquidations surged to approximately $1.14 billion within a short time window. The breakdown shows a heavy imbalance toward bullish traders:
- Long liquidations: ~$1.08 billion
- Short liquidations: ~$66 million
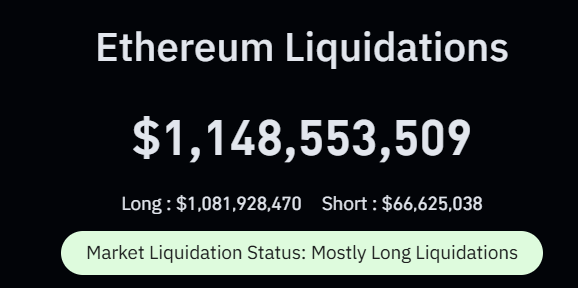
This clearly indicates that the majority of traders were positioned for upside continuation, expecting ETH’s January bounce to hold. Instead, the sharp breakdown flushed out over-leveraged longs, accelerating the sell-off and driving price swiftly into lower demand zones.
Historically, such one-sided liquidation events often mark panic phases, where weak hands are forced out of positions — sometimes setting the stage for a trend reset.
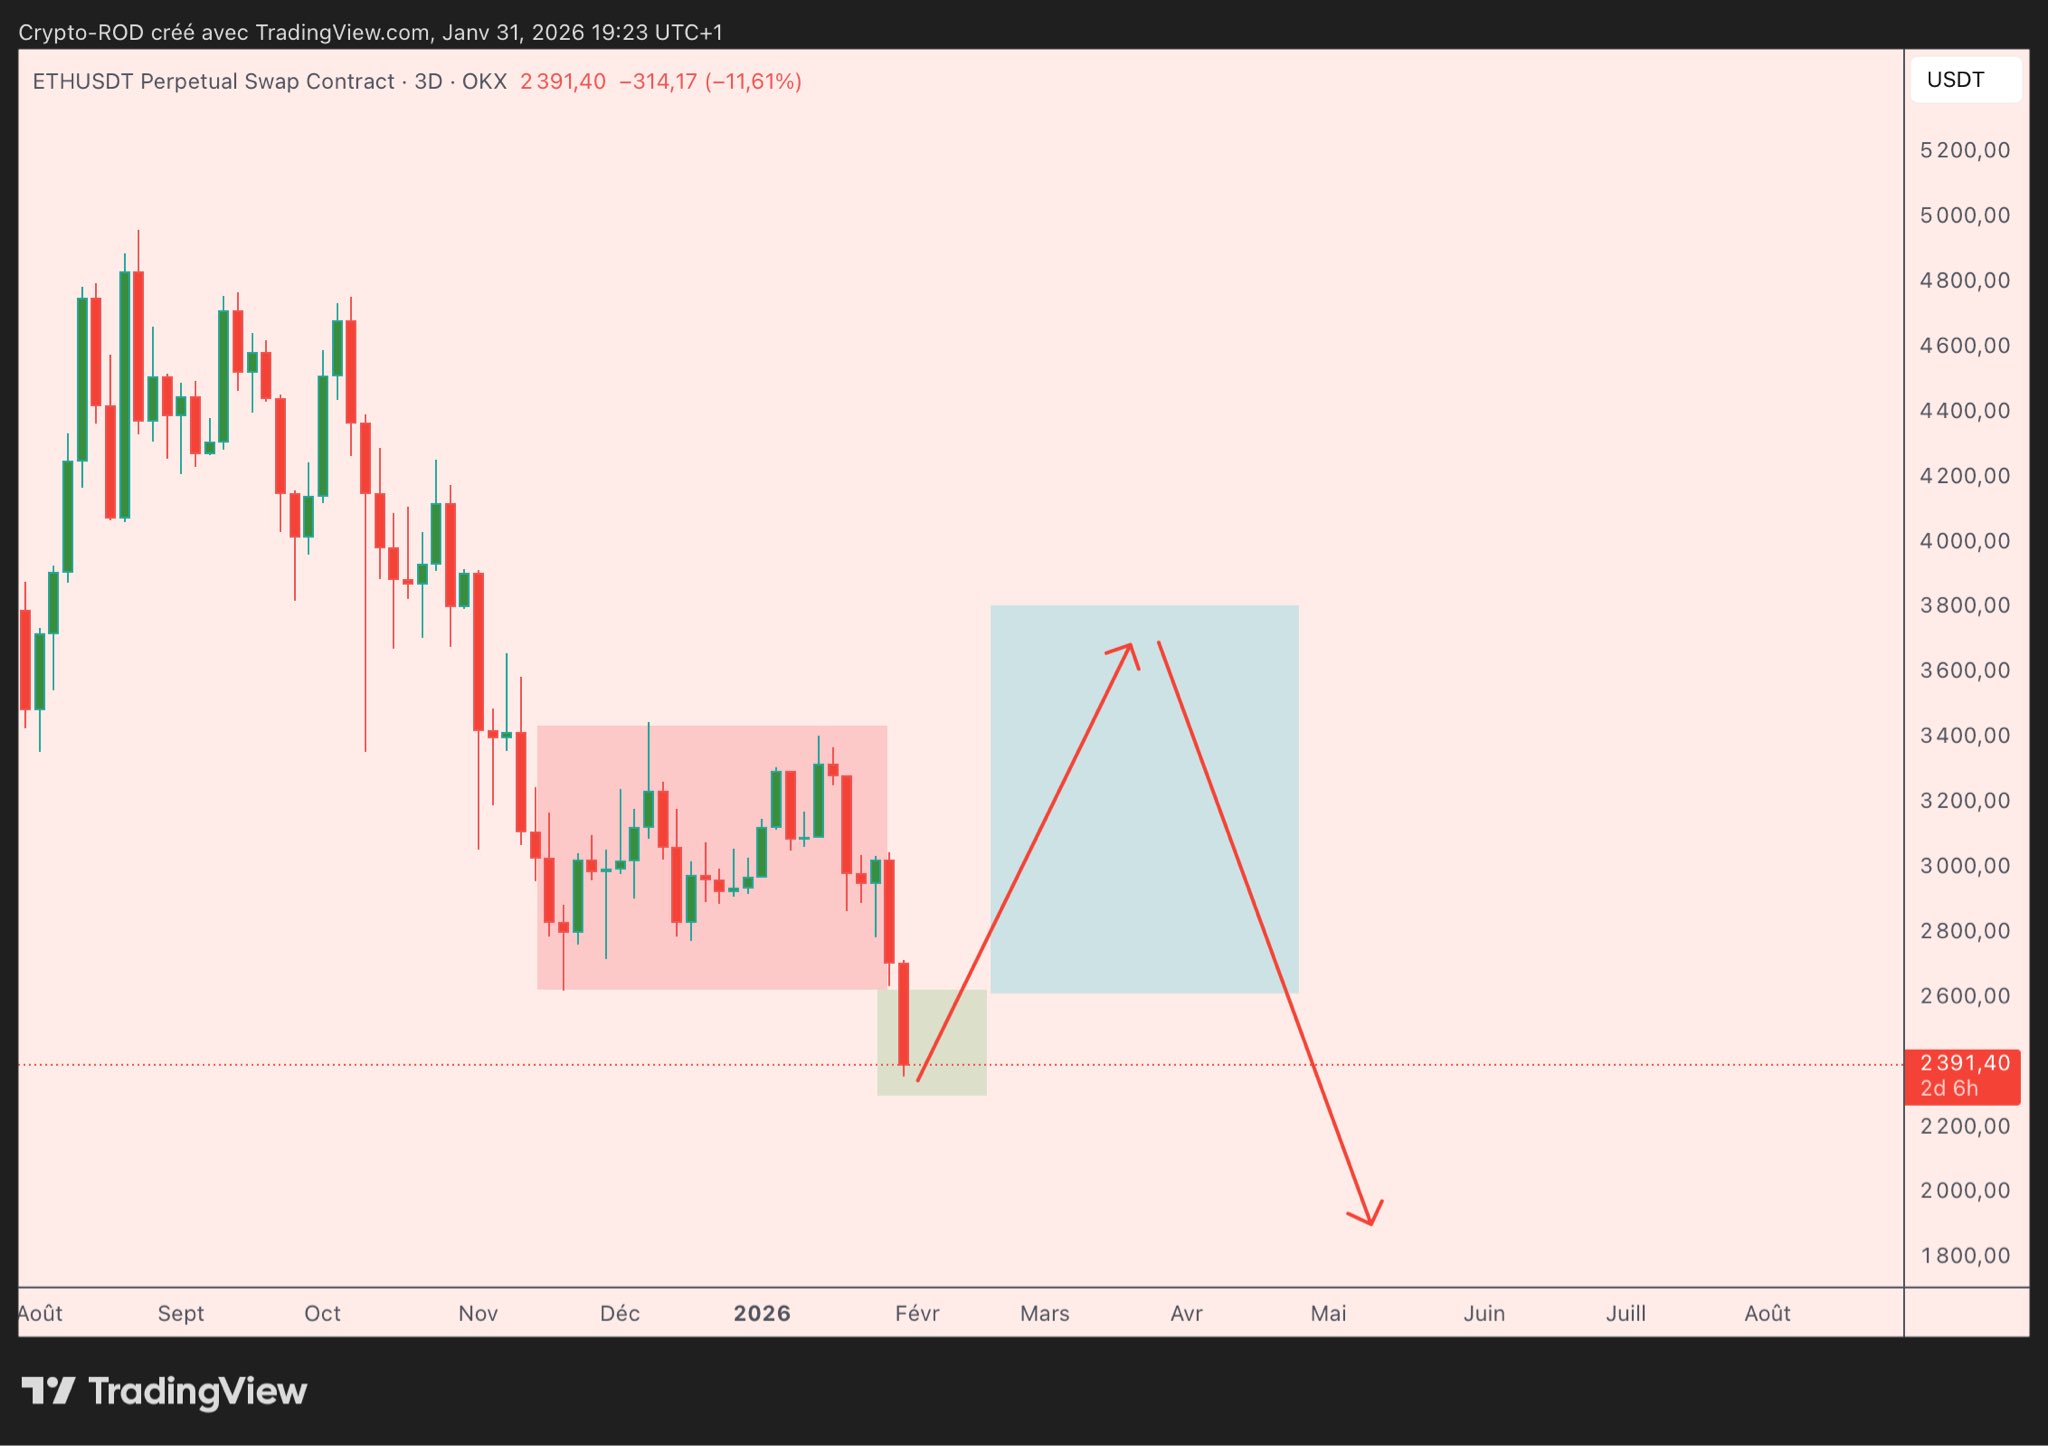
Power of 3 setup taking shape on the higher timeframe
Looking at the 3-day chart shared by crypto analyst Crypto-ROD, Ethereum appears to be developing a potential Power of 3 (PO3) structure — a pattern that plays out in three distinct phases: Accumulation → Manipulation → Expansion.
In ETH’s case, price previously ranged inside an accumulation zone near $2,620, where the market spent weeks building liquidity. The recent breakdown below this level marked the start of the manipulation phase, trapping late buyers and triggering cascading liquidations as price slid toward the $2,247 region.
This kind of sharp downside deviation often acts as a shakeout, clearing excessive leverage before the market chooses its true direction.
What’s next for ETH in February?
If the PO3 structure continues to play out, Ethereum could see one more downside sweep toward the next support area around $2,128. A reaction from this zone would be critical, as it may attract dip buyers looking for a higher-timeframe reversal.
Should bulls regain control and manage to reclaim the former accumulation resistance near $2,620, that would significantly strengthen the case for a bullish expansion phase. In such a scenario, ETH could begin a broader recovery move with upside projections extending toward the $4,500+ region over the coming months.
On the flip side, a failure to hold above the $2,128 support would invalidate the Power of 3 setup altogether, opening the door for deeper downside and prolonged consolidation.
For now, Ethereum enters February at a crucial inflection point — shaken by massive liquidations, but potentially laying the groundwork for its next major move.
Disclaimer: The views and analysis presented in this article are for informational purposes only and reflect the author’s perspective, not financial advice. Technical patterns and indicators discussed are subject to market volatility and may or may not yield the anticipated results. Investors are advised to exercise caution, conduct independent research, and make decisions aligned with their individual risk tolerance.
About Author: Nilesh Hembade is the Founder and Lead Author of Coinsprobe, with over 5 years of experience in the cryptocurrency and blockchain industry. Since launching Coinsprobe in 2023, he has been providing daily, research-driven insights through in-depth market analysis, on-chain data, and technical research.

The opinions and market insights shared on CoinsProbe represent the views of individual authors based on prevailing market conditions at the time of publication. Cryptocurrency investments carry significant risk and volatility. Readers are encouraged to conduct their own research and seek professional financial advice before making investment decisions. CoinsProbe and its contributors do not accept responsibility for financial losses or decisions made based on published content.
CoinsProbe may publish sponsored articles, affiliate links, or promotional collaborations. All sponsored material is clearly labeled to maintain transparency with our audience. Our editorial decisions remain fully independent, and advertising partnerships do not influence reviews, rankings, or published opinions.
Since 2023, CoinsProbe has delivered reliable insights on cryptocurrency, blockchain, and digital assets. Our content is created by experienced researchers and analysts who follow strict editorial standards focused on accuracy, transparency, and credibility. Every article is carefully reviewed and verified using trusted sources and current market data. We provide unbiased analysis and timely updates covering everything from emerging crypto projects to major industry developments.