Date: Tue, Nov 19, 2024, 06:36 AM GMT
The cryptocurrency market continues its bullish surge, fueled by Bitcoin’s remarkable 30% rally over the 30 days. Following the king of crypto, major altcoins like Chainlink (LINK) and Polkadot (DOT) are riding the wave, both posting impressive gains of over 30% in the last 30 days.

Both tokens appear to be following a similar path, with their charts revealing critical breakout patterns that could define the next phase of their rallies. Let’s analyze these two tokens to understand their potential moves.
Chainlink (LINK):
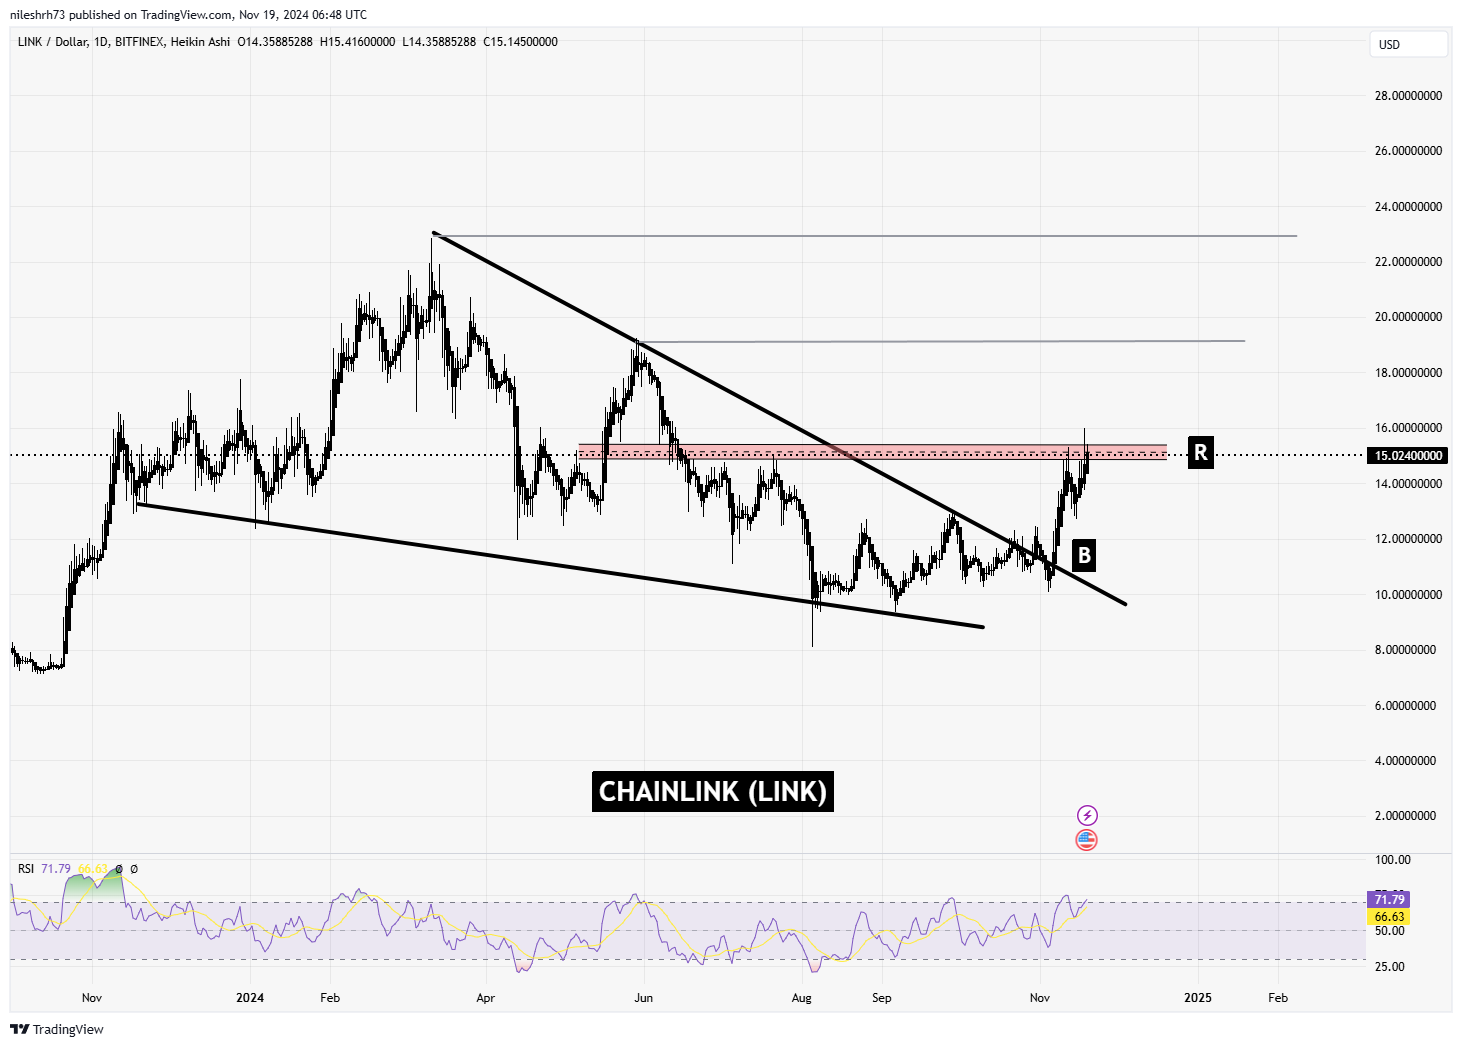
Since breaking out of a descending trendline earlier this month at $11.12, LINK confirmed its bullish momentum with a breakout from a broader bullish wedge pattern. This has propelled LINK to its current price of approximately $15, a key resistance zone that has been tested repeatedly. A decisive move above this level could trigger a sustained rally.

Immediate Resistance: The $15.02 level is the key resistance zone for LINK. A breakout above this critical level could signal the continuation of its bullish momentum and pave the way for further upside.
Upper Targets: If LINK successfully breaches the resistance, it could aim for higher targets at $19.00 and $22.88. A sustained rally beyond these levels would confirm a robust uptrend, signaling significant gains ahead.
Polkadot (DOT):
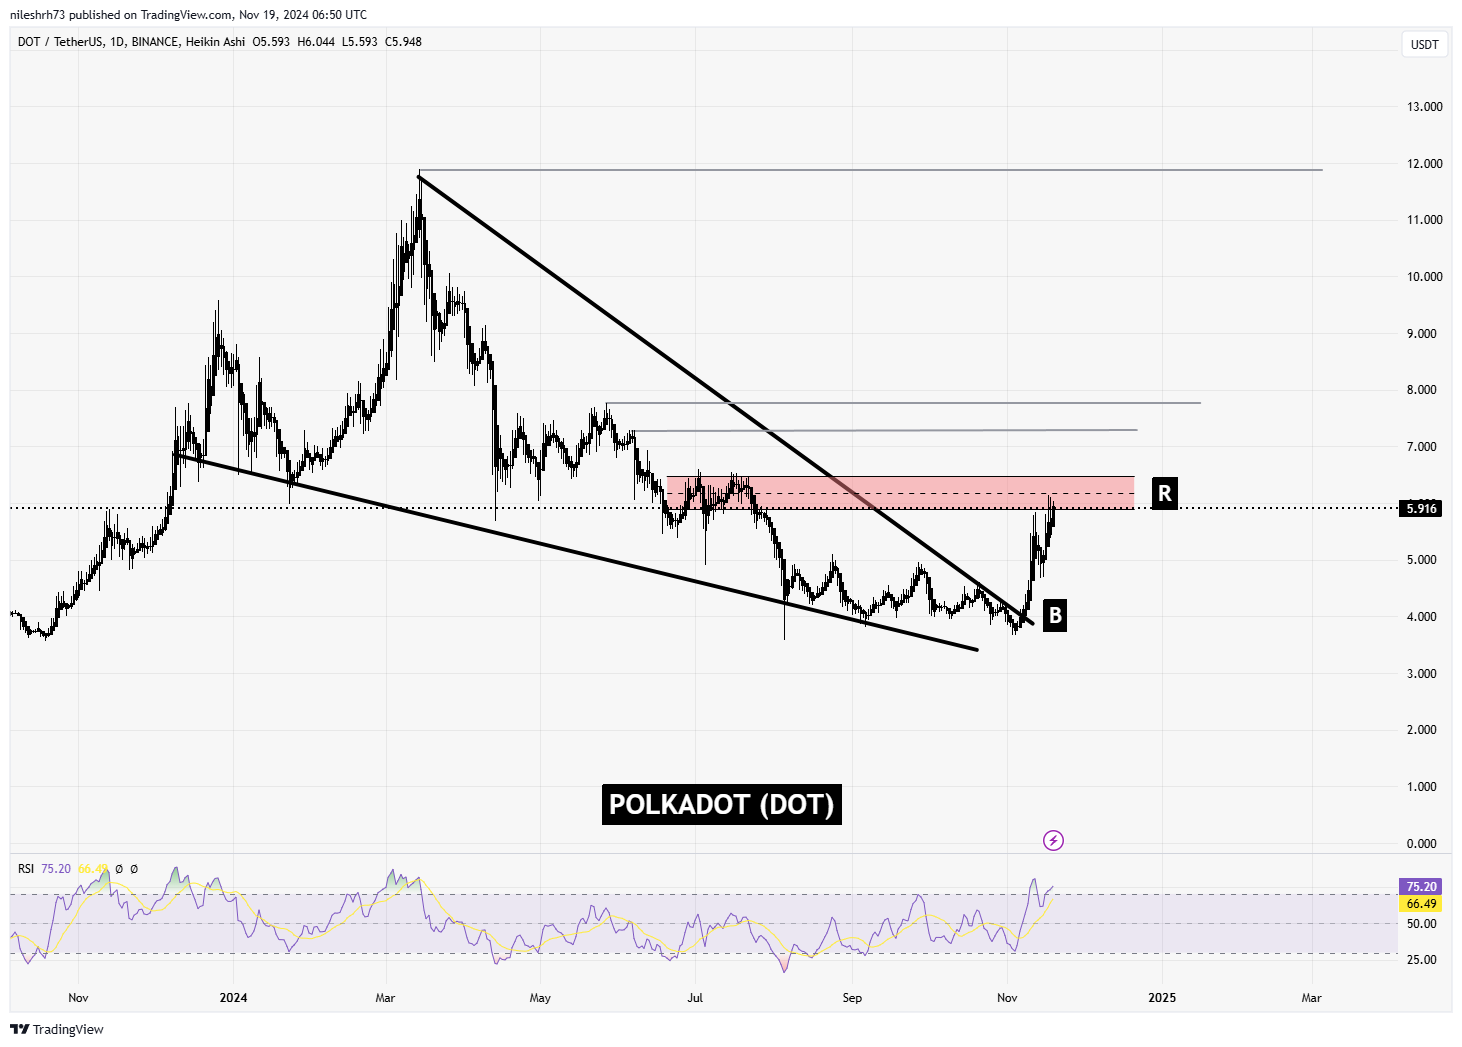
DOT, like LINK, has displayed significant bullish momentum this month. After breaking out of a descending trendline earlier this month at $4.09, DOT confirmed its upward trajectory with a breakout from a bullish wedge pattern. This move has brought DOT to its current level, hovering near the critical resistance zone of $6.47. A decisive breakout above this resistance could pave the way for substantial gains.

Immediate Resistance: The $6.47 level represents a critical hurdle for DOT at its current stage. A decisive breakout above this zone could confirm bullish momentum and set the stage for further gains.
Upper Targets: Should DOT clear the immediate resistance, it could advance to $7.27 and $7.78 as its next targets. Sustained upward momentum beyond these levels could push DOT toward its long-term goal of $11.87, marking a significant milestone for the token.
Similar Trajectories: A Mirror in the Market?
Both LINK and DOT exhibit patterns of bullish momentum fueled by broader market conditions and technical breakouts. Their wedge breakout formations suggest that they may still have considerable room for growth.
While LINK is slightly ahead in breaking resistance zones, DOT is catching up with strong support levels and momentum. These tokens demonstrate how altcoins can mirror each other’s behavior during bullish phases, especially when paired with Bitcoin’s strong performance.
Conclusion:
Both LINK and DOT are at critical junctures, with their next moves depending on successful resistance breakouts. A surge above these levels could propel them toward their upper targets, while rejections may lead to consolidation or retests of prior breakout levels.
Disclaimer: This article is for informational purposes only and does not constitute financial advice. Always conduct your own research before making investment decisions.


