Date: Wed, Jan 15, 2025, 09:21 AM GMT
In the cryptocurrency market, significant corrections have been observed since the last month following bullish rallies in November. Among the affected assets, Celestia (TIA) has faced a sharp 27% decline over the last 30 days, pushing its price toward a critical long-term support level.

Testing Key Support
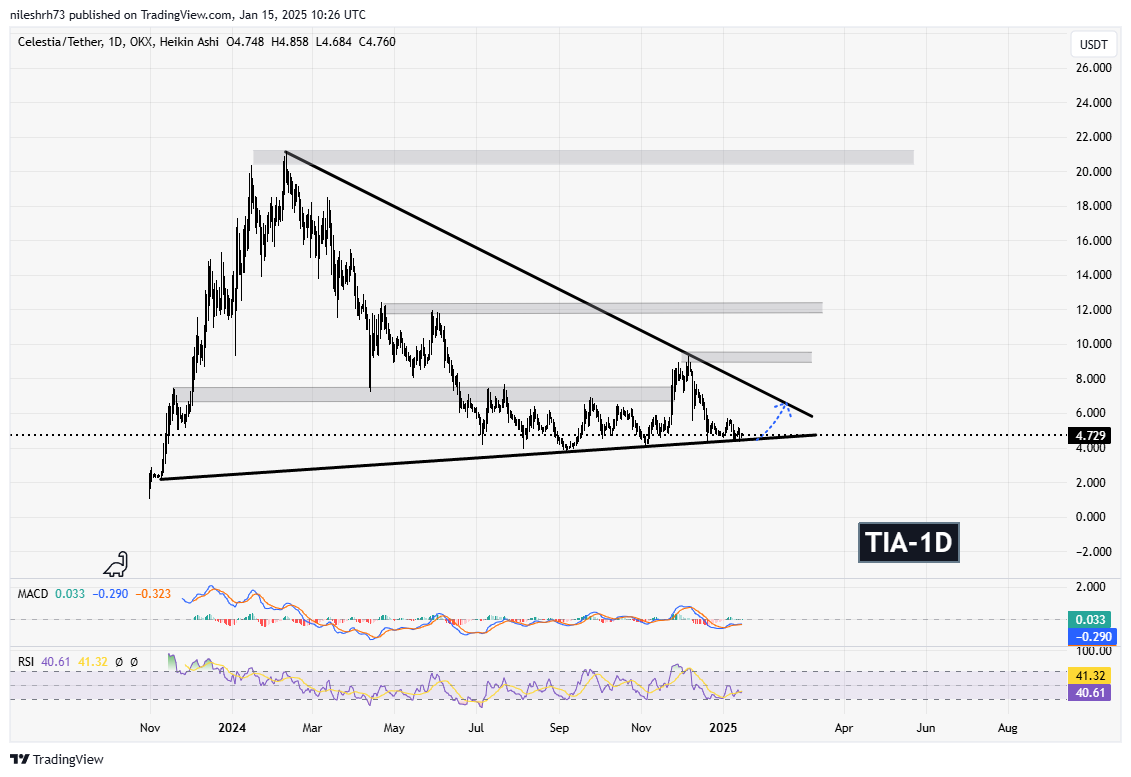
Celestia (TIA) is currently consolidating within a symmetrical triangle pattern. Recent rejection from the upper resistance level at $9.28 has led the token to test its major long-term support trendline. This trendline has historically acted as a robust foundation during periods of correction, suggesting its importance in the current scenario.

Currently, at $4.72, TIA appears to be stabilizing at this pivotal support. Momentum indicators like MACD and RSI reflect near-oversold conditions, suggesting potential bullish momentum.
If this support holds, TIA could aim for a recovery rally toward the upper resistance of the symmetrical triangle.
Elliott Wave Theory Hints at Bullish Reversal
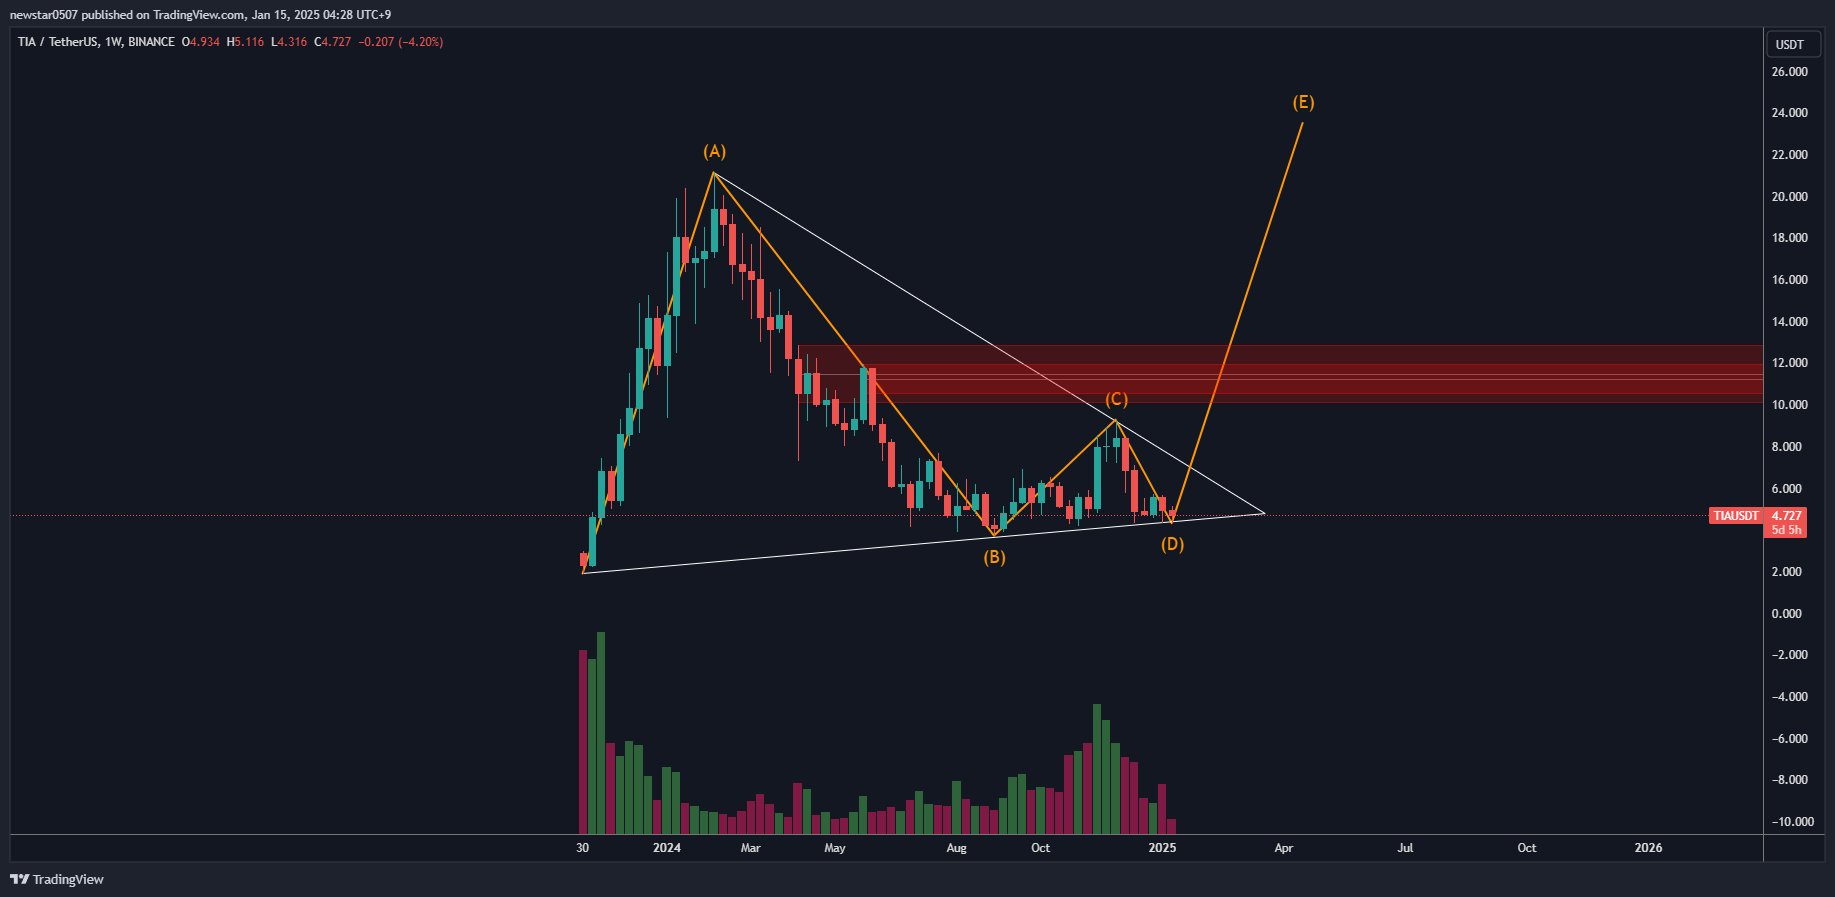
Renowned crypto trader @CW8900 on X has shared insights suggesting that TIA remains confined within the symmetrical triangle that has persisted since its Binance listing. The price has now touched the bottom of this triangle twice, and Elliott Wave analysis indicates the potential for a bullish 5th wave breakout.

According to the Elliott Wave structure:
- The 5th wave, if realized, could represent a significant breakout upward from the triangle convergence.
- Based on previous waves, this upward trajectory could potentially bring TIA to $23.5, marking a major recovery.
However, an interim challenge lies in the $12-$12.8 range, where a considerable sell wall exists. While this resistance may initially slow progress, the onset of a broader bull market could pave the way for TIA to achieve its target.
Conclusion: What Lies Ahead for Celestia?
Celestia’s price action near this critical support level will likely determine its next significant move. A breakout above the triangle would confirm a bullish reversal, potentially aligning with the Elliott Wave projection of reaching $23.5. However, failure to hold the $4.70 support could lead to further downside risks.
Disclaimer: This article is for informational purposes only and does not constitute financial advice. Always conduct your own research before making any investment decisions.

