
Key Takeaways
- Bitcoin has dropped into a major 10-month support zone between $74,500–$78,600
- The weekly chart shows a developing head and shoulders structure
- BTC has corrected nearly 40% from its all-time high near $121,900
- Reclaiming the 100-week MA around $87,263 could trigger a move toward $109,568
- A breakdown below support may expose BTC to deeper downside toward the $49,000 region
Bitcoin has entered a critical phase in early February 2026, sliding into a zone that hasn’t been meaningfully tested in nearly ten months. After weeks of sustained selling pressure, BTC has dropped into the $74,500–$78,600 support range, an area that previously acted as a strong base during April-2025.
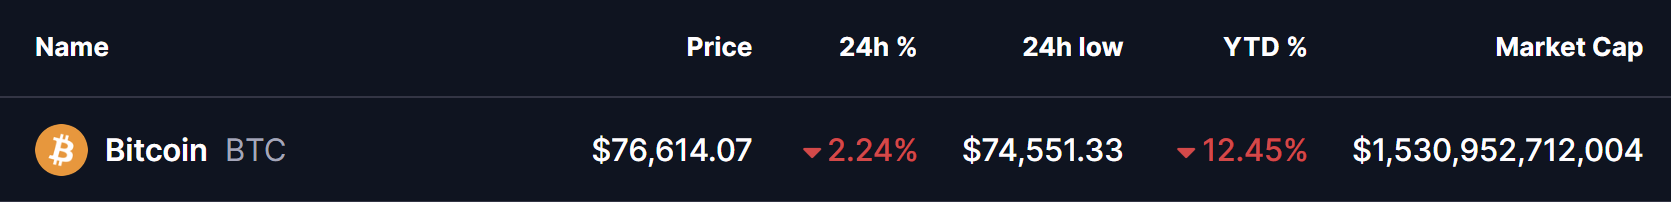
As of February 2, 2026, Bitcoin is trading near $76,614, down 2.24% over the past 24 hours, with an intraday low touching $74,551. On a broader scale, BTC is now down 12.45% year-to-date, erasing a large portion of the late-2025 rally and pushing market sentiment back into caution mode.
Yet, while price action looks heavy on the surface, the weekly chart structure suggests this move may be more than just panic-driven selling.
A Head and Shoulders Structure Near Completion
On the weekly timeframe, Bitcoin is carving out a developing head and shoulders pattern, a classic structure that often marks a major transition in trend. The “head” of the pattern formed near Bitcoin’s all-time high region around $121,900, from where BTC has corrected roughly 40% at its worst point.
The recent breakdown below the 100-week moving average, currently near $87,263, accelerated downside momentum and dragged price directly into the neckline support zone between $74,500 and $78,600.
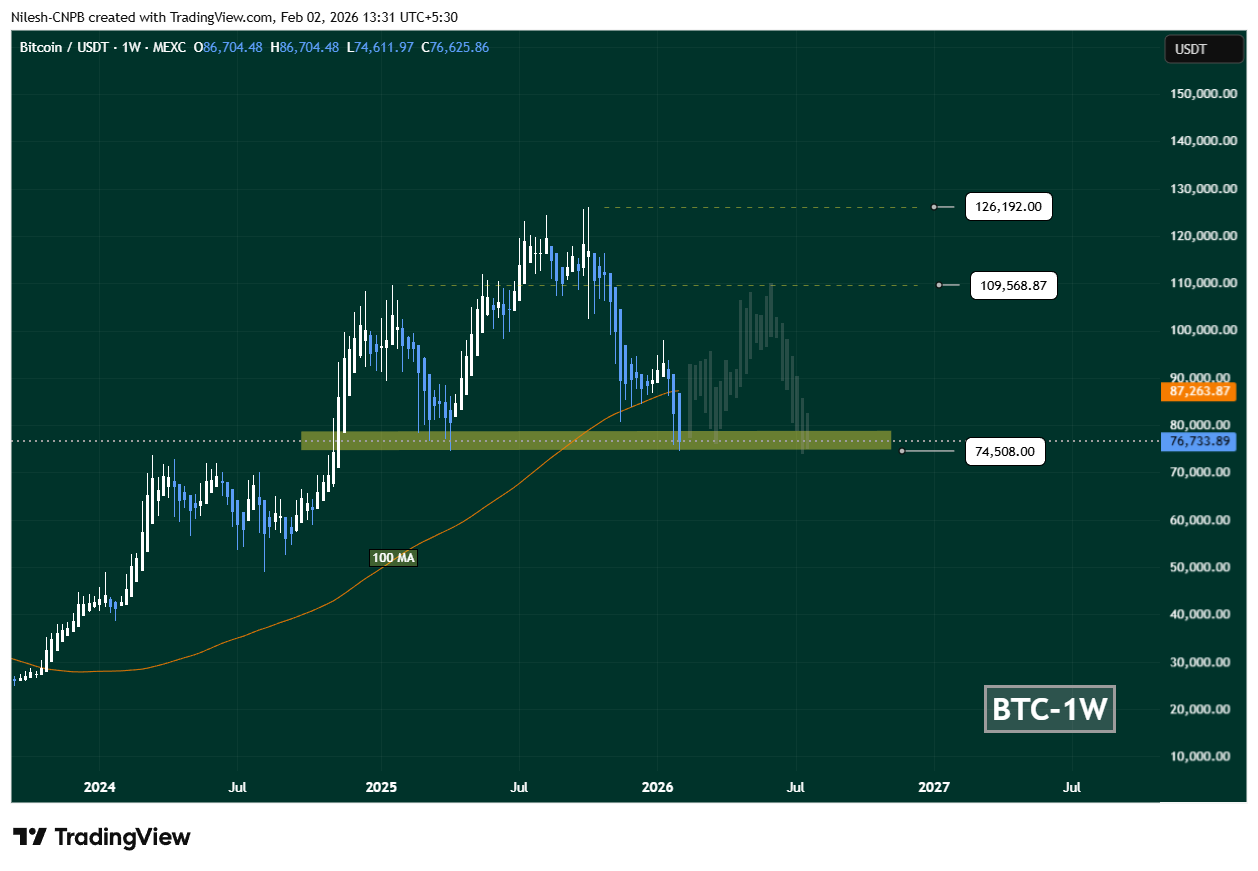
This neckline is not just a random horizontal level. Historically, it has acted as a high-demand area, absorbing selling pressure and triggering strong rebounds. The latest weekly candle shows a clear downside wick into this zone, hinting that selling momentum may be weakening as buyers cautiously step in.
Liquidity Clusters Hint at a Potential Upside Magnet
Adding weight to the rebound narrative, Coinglass data highlights over $2.60 billion in liquidity stacked above the $87,000 region. This cluster creates a potential upside magnet if price manages to stabilize and reclaim key resistance levels.
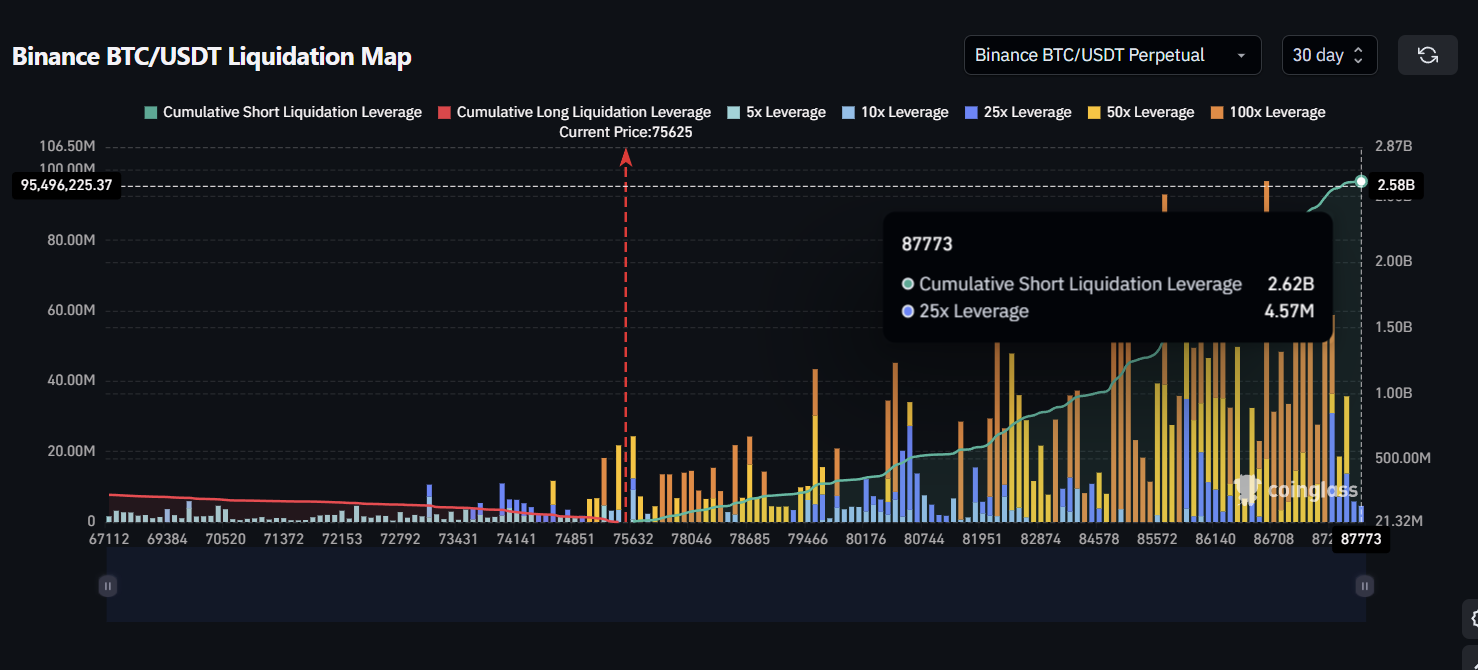
From a market mechanics perspective, such liquidity zones often attract price once downside pressure cools, especially after a prolonged corrective move like the one Bitcoin has just experienced.
What the Chart Suggests Going Forward
If Bitcoin manages to defend the neckline support and reclaims the 100-week MA near $87,263, momentum could shift meaningfully in favor of bulls. In that scenario, a recovery toward the $109,568 region becomes technically plausible — representing a potential 40%+ upside move from current levels.
Such a rally would likely form the right shoulder of the larger head and shoulders structure, leaving BTC at a critical decision point between trend continuation or renewed consolidation.
On the flip side, failure to hold the $74,500–$78,600 zone would significantly weaken the structure. A clean breakdown below this area could open the door to a deeper correction toward the $49,000 region, where the next major liquidity pocket and historical support reside.
The Market’s Defining Moment
For now, Bitcoin is sitting at a make-or-break level. The neckline zone remains the battlefield where bulls and bears are actively fighting for control. How price reacts here will likely set the tone for the next major trend — whether that’s a relief rally driven by liquidity hunts or a continuation of the broader corrective phase.
One thing is clear: this is not a level the market can ignore.
Disclaimer: The views and analysis presented in this article are for informational purposes only and reflect the author’s perspective, not financial advice. Technical patterns and indicators discussed are subject to market volatility and may or may not yield the anticipated results. Investors are advised to exercise caution, conduct independent research, and make decisions aligned with their individual risk tolerance.
About Author: Nilesh Hembade is the Founder and Lead Author of Coinsprobe, with over 5 years of experience in the cryptocurrency and blockchain industry. Since launching Coinsprobe in 2023, he has been providing daily, research-driven insights through in-depth market analysis, on-chain data, and technical research.

The opinions and market insights shared on CoinsProbe represent the views of individual authors based on prevailing market conditions at the time of publication. Cryptocurrency investments carry significant risk and volatility. Readers are encouraged to conduct their own research and seek professional financial advice before making investment decisions. CoinsProbe and its contributors do not accept responsibility for financial losses or decisions made based on published content.
CoinsProbe may publish sponsored articles, affiliate links, or promotional collaborations. All sponsored material is clearly labeled to maintain transparency with our audience. Our editorial decisions remain fully independent, and advertising partnerships do not influence reviews, rankings, or published opinions.
Since 2023, CoinsProbe has delivered reliable insights on cryptocurrency, blockchain, and digital assets. Our content is created by experienced researchers and analysts who follow strict editorial standards focused on accuracy, transparency, and credibility. Every article is carefully reviewed and verified using trusted sources and current market data. We provide unbiased analysis and timely updates covering everything from emerging crypto projects to major industry developments.