

Date: Thu, Jan 30, 2025, 04:23 AM GMT
The cryptocurrency market is experiencing positive momentum today as Bitcoin (BTC) surged by 3%, reclaiming the $105K mark. This move follows the Federal Reserve’s decision to maintain the federal funds rate at 4.25%-4.50%.
Following BTC’s lead, top memecoins Pepe (PEPE) and Dogecoin (DOGE) are also trading in green today. However, despite their recent bounce, both are still recovering from their corrections—PEPE has dropped 22% in the past 60 days, while DOGE is down 37%.

Now, fresh analysis by prominent crypto traders suggests that both assets are repeating historical bullish patterns, hinting at potential breakout rallies.
Pepe (PEPE) Analysis
According to crypto analyst @ChandlerCharts, PEPE is mirroring its price action from the 2023/24 cycle, where a major 50% correction was followed by a massive rally.
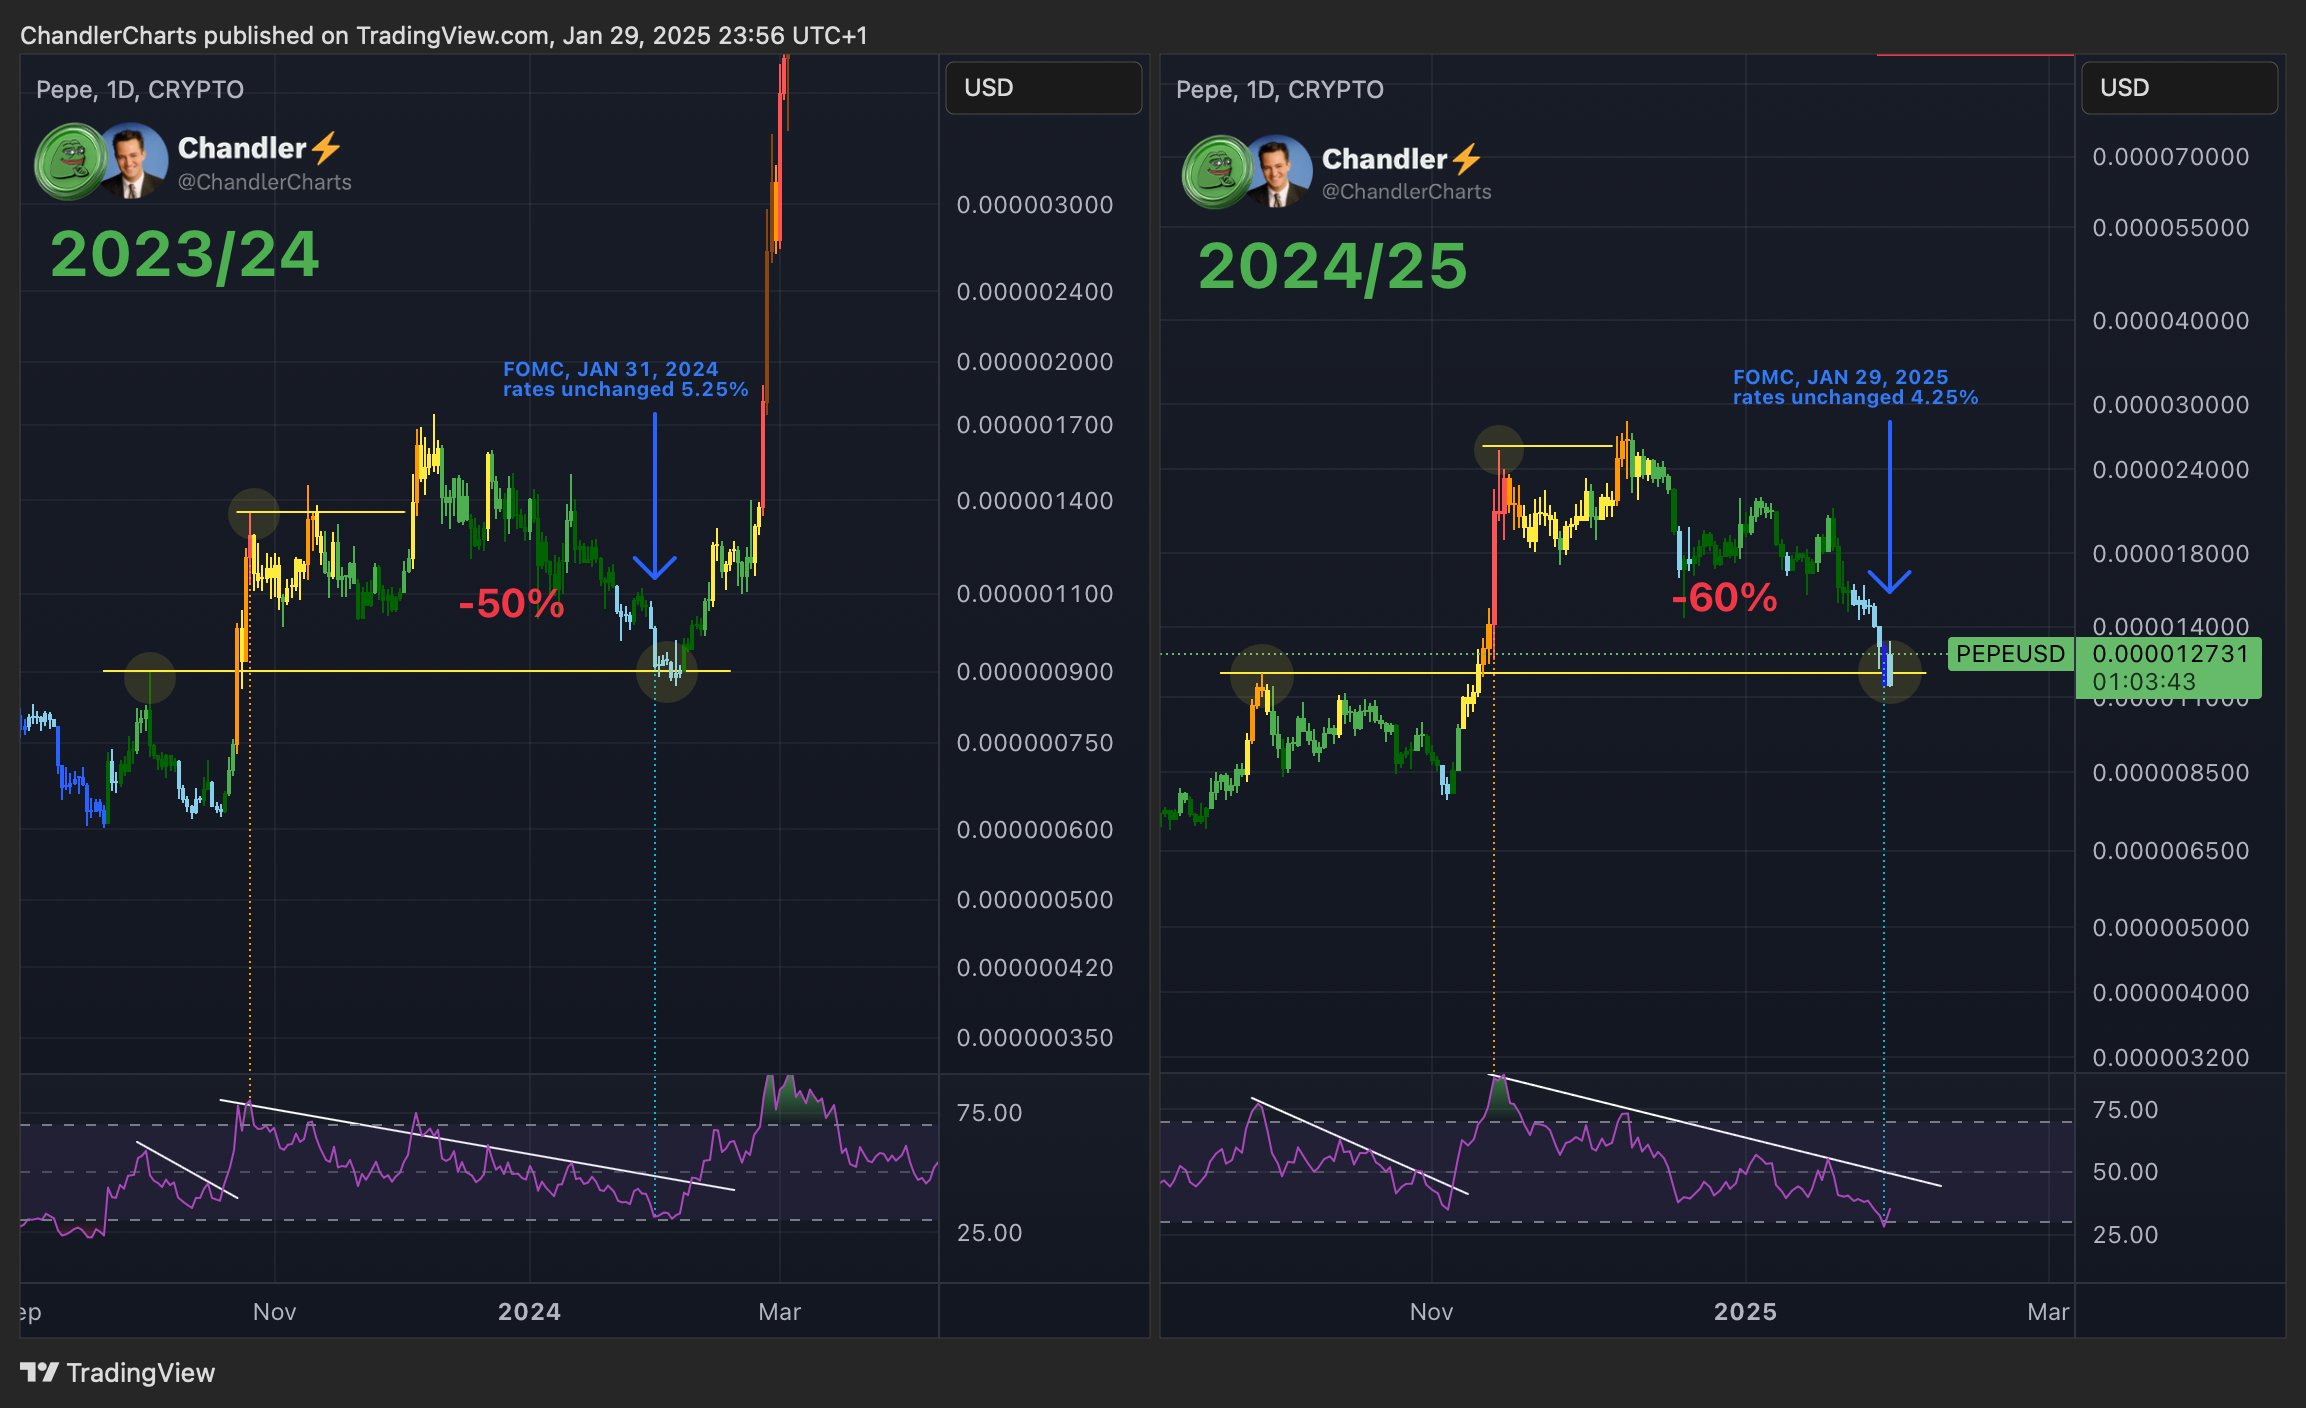
The current price structure of PEPE is closely following its 2023/24 cycle, which saw a 50% correction before a parabolic surge. The 2024/25 cycle has already experienced a 60% dip, similar to last year.
In 2024, PEPE bottomed right after the January 31 FOMC meeting, where interest rates remained unchanged. A similar reaction is occurring now after the January 29, 2025, FOMC decision, with PEPE bouncing from key support.
The RSI (Relative Strength Index) has been following the same downtrend pattern as last year before a breakout. If this trend continues, PEPE could be preparing for a major bullish move.
If PEPE follows the previous cycle, it could rally back to its November highs and potentially break into new all-time highs.
Dogecoin (DOGE) Analysis
Crypto analyst @TATrader_Alan highlights that DOGE is currently in its third market cycle and is showing a textbook accumulation pattern, similar to previous explosive bull runs.

DOGE has been following a repeating pattern seen in Cycle 1 (2017) and Cycle 2 (2021). Each cycle involved an extended accumulation phase, followed by a major parabolic rally.
The chart shows higher lows marked in green, indicating steady accumulation. A major trendline breakout and correction phase, similar to 2017’s Cycle 1 and 2021’s Cycle 2, is marked in a yellow circle, mirroring the current setup of Cycle 3. If history repeats, it could ignite the next leg up.
If the pattern holds, according to the analyst, DOGE could surge toward $3.0 – $5.0 in the coming months.
Final Thoughts
Both PEPE and DOGE are showing strong historical fractals, aligning with their past breakout patterns. With the broader market turning bullish and Bitcoin leading the way, these two memecoins could be gearing up for their next explosive rallies.
However, as always, market conditions can change rapidly, so it is crucial to monitor key levels and macroeconomic factors before making any investment decisions.

Disclaimer: This article is for informational purposes only and not financial advice. Always conduct your own research before investing in cryptocurrencies.

The opinions and market insights shared on CoinsProbe represent the views of individual authors based on prevailing market conditions at the time of publication. Cryptocurrency investments carry significant risk and volatility. Readers are encouraged to conduct their own research and seek professional financial advice before making investment decisions. CoinsProbe and its contributors do not accept responsibility for financial losses or decisions made based on published content.
CoinsProbe may publish sponsored articles, affiliate links, or promotional collaborations. All sponsored material is clearly labeled to maintain transparency with our audience. Our editorial decisions remain fully independent, and advertising partnerships do not influence reviews, rankings, or published opinions.
Since 2023, CoinsProbe has delivered reliable insights on cryptocurrency, blockchain, and digital assets. Our content is created by experienced researchers and analysts who follow strict editorial standards focused on accuracy, transparency, and credibility. Every article is carefully reviewed and verified using trusted sources and current market data. We provide unbiased analysis and timely updates covering everything from emerging crypto projects to major industry developments.