
Key Takeaways
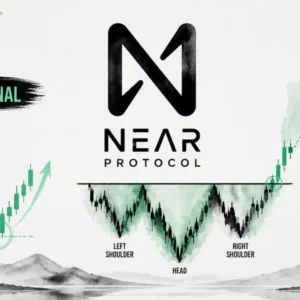
- RAY is up 20% on the week and is forming a potential inverse head and shoulders, signaling a possible trend reversal after a prolonged downtrend.
- A move from current levels toward the $1.27 neckline (around 80% upside) could help complete the right shoulder of the pattern.
- Bulls must defend the $0.5035 support — a breakdown below this area would invalidate the bullish setup.
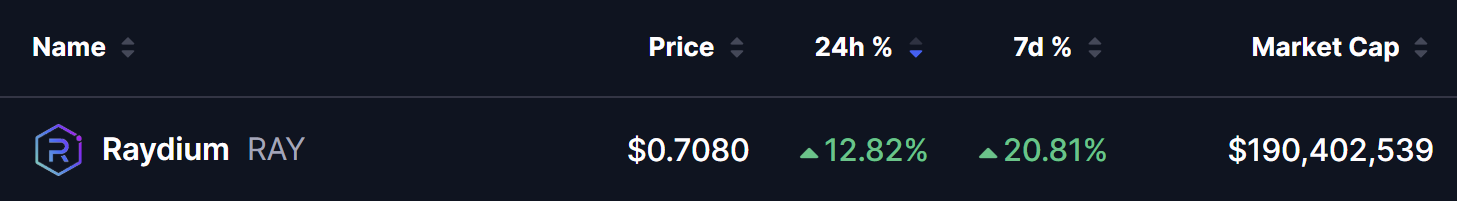
RAY, the native utility and governance token of Raydium, is starting to regain traction after weeks of heavy selling pressure. The token is up more than 12% today and has extended its weekly rally to nearly 20%, standing out as one of the stronger performers while Bitcoin and Ethereum cool off.
More importantly, RAY’s daily chart is now flashing a potential trend-reversal structure, hinting that buyers may be preparing for a broader recovery move.
Potential Inverse Head and Shoulders in Play
On the daily timeframe, RAY appears to be forming a potential inverse head and shoulders pattern — a classic bullish reversal formation that often develops after prolonged downtrends.
Here’s how the structure is shaping up on the chart:
- The left shoulder formed near the $0.83 zone, where buyers initially stepped in.
- This was followed by a deeper sell-off toward $0.5035, forming the head of the pattern and marking the local bottom.
- Price then rebounded back above $0.70, and RAY is now attempting to build the head of the pattern as momentum slowly improves.
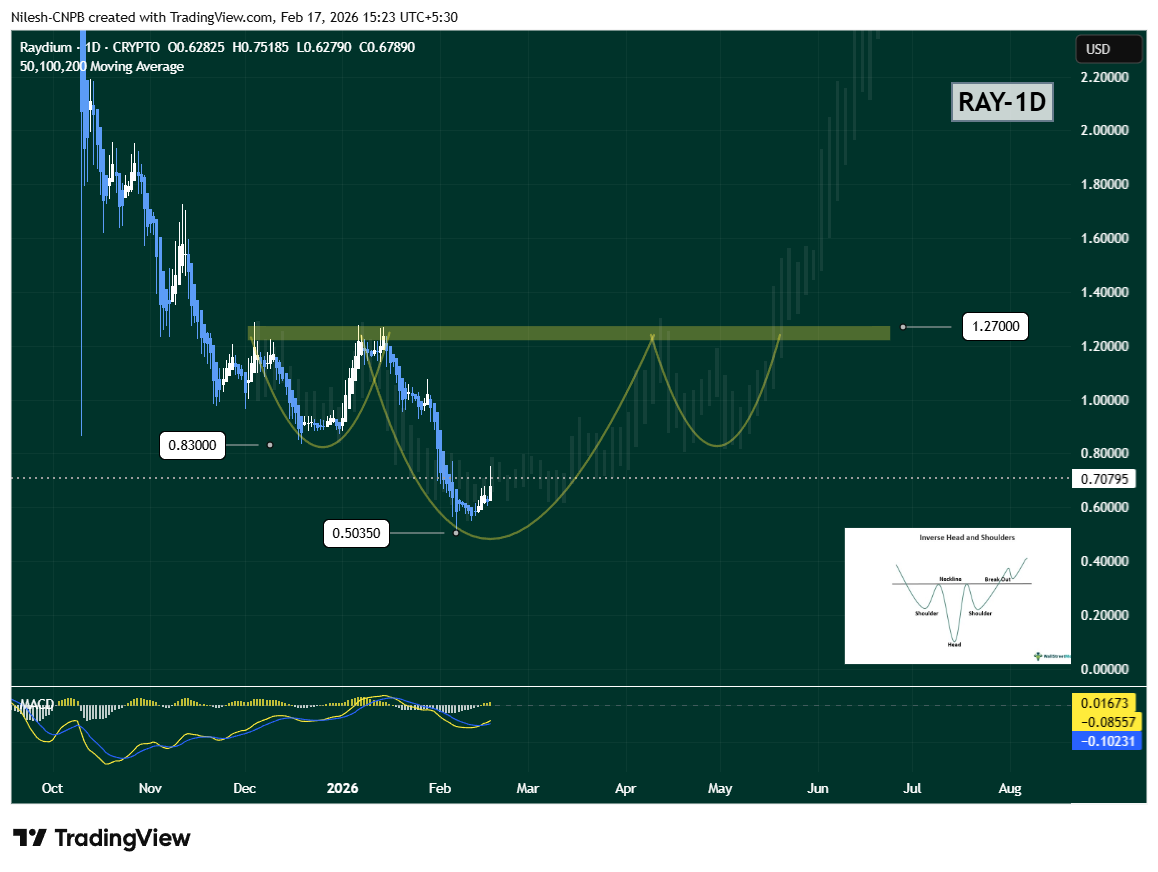
At the same time, the MACD indicator on the daily chart is curling higher, with histogram bars starting to flip positive — an early signal that bearish momentum is fading and bullish pressure may be building beneath the surface.
This combination of a developing inverse head and shoulders alongside improving MACD structure adds weight to the short-term bullish narrative.
What’s Next for RAY?
If this setup continues to develop, RAY could consolidate around the $0.70 region before attempting a move toward the $1.27 neckline resistance — a level that represents nearly 80% upside from current prices.
A push into this zone would also help complete the right shoulder of the inverse head and shoulders structure.
Key Risk to Watch
It’s worth noting that this pattern is still developing and not yet confirmed.
For the bullish structure to remain valid, buyers must defend the $0.5035 support. A breakdown below this level would invalidate the inverse head and shoulders setup and likely delay any recovery, potentially leading to renewed consolidation or another leg lower.
Disclaimer: The views and analysis presented in this article are for informational purposes only and reflect the author’s perspective, not financial advice. Technical patterns and indicators discussed are subject to market volatility and may or may not yield the anticipated results. Investors are advised to exercise caution, conduct independent research, and make decisions aligned with their individual risk tolerance.
About Author: Nilesh Hembade is the Founder and Lead Author of Coinsprobe, with over 5 years of experience in the cryptocurrency and blockchain industry. Since launching Coinsprobe in 2023, he has been providing daily, research-driven insights through in-depth market analysis, on-chain data, and technical research.
The opinions and market insights shared on CoinsProbe represent the views of individual authors based on prevailing market conditions at the time of publication. Cryptocurrency investments carry significant risk and volatility. Readers are encouraged to conduct their own research and seek professional financial advice before making investment decisions. CoinsProbe and its contributors do not accept responsibility for financial losses or decisions made based on published content.
CoinsProbe may publish sponsored articles, affiliate links, or promotional collaborations. All sponsored material is clearly labeled to maintain transparency with our audience. Our editorial decisions remain fully independent, and advertising partnerships do not influence reviews, rankings, or published opinions.
Since 2023, CoinsProbe has delivered reliable insights on cryptocurrency, blockchain, and digital assets. Our content is created by experienced researchers and analysts who follow strict editorial standards focused on accuracy, transparency, and credibility. Every article is carefully reviewed and verified using trusted sources and current market data. We provide unbiased analysis and timely updates covering everything from emerging crypto projects to major industry developments.