
Key Takeaways
- RENDER is forming a double bottom near $1.13, signaling fading selling pressure and a potential bullish reversal.
- A reclaim of the 50-day moving average around $1.69 could open the path toward the $2.62–$2.68 neckline.
- Bulls must defend $1.13 support — a breakdown below this level would invalidate the bullish setup.
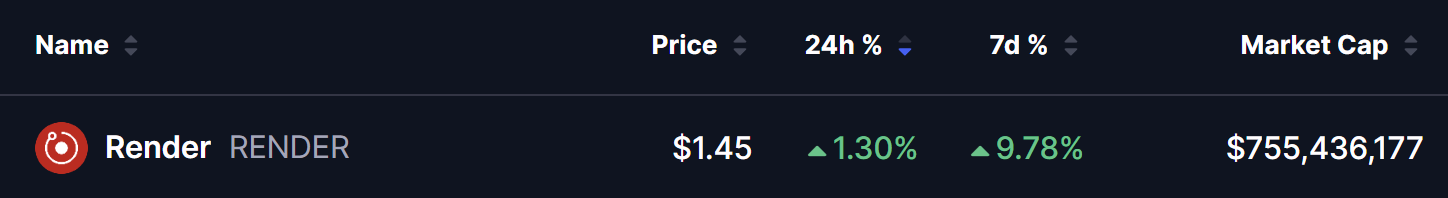
RENDER, the native token of the Render Network — a decentralized platform focused on GPU computing — is starting to regain traction after weeks of heavy selling pressure. The token is up over 9% in the past seven days, hinting that buyers may finally be stepping back in.
More importantly, RENDER’s daily chart is now flashing a classic bullish reversal setup, suggesting the recent downtrend could be losing steam.
Technical Patterns Hint at Upside Momentum
On the daily timeframe, RENDER appears to be forming a double bottom pattern, a well-known structure that often develops near the end of prolonged declines.
Here’s how the setup is unfolding on the chart:
- The first bottom formed as price dropped into the $1.13 support zone, followed by a sharp rebound.
- That bounce carried RENDER toward the neckline resistance around $2.68, where sellers stepped back in and rejected the move.
- Price then rolled over and returned to the same $1.13 area, but this time, buyers defended the level again — creating the second bottom.
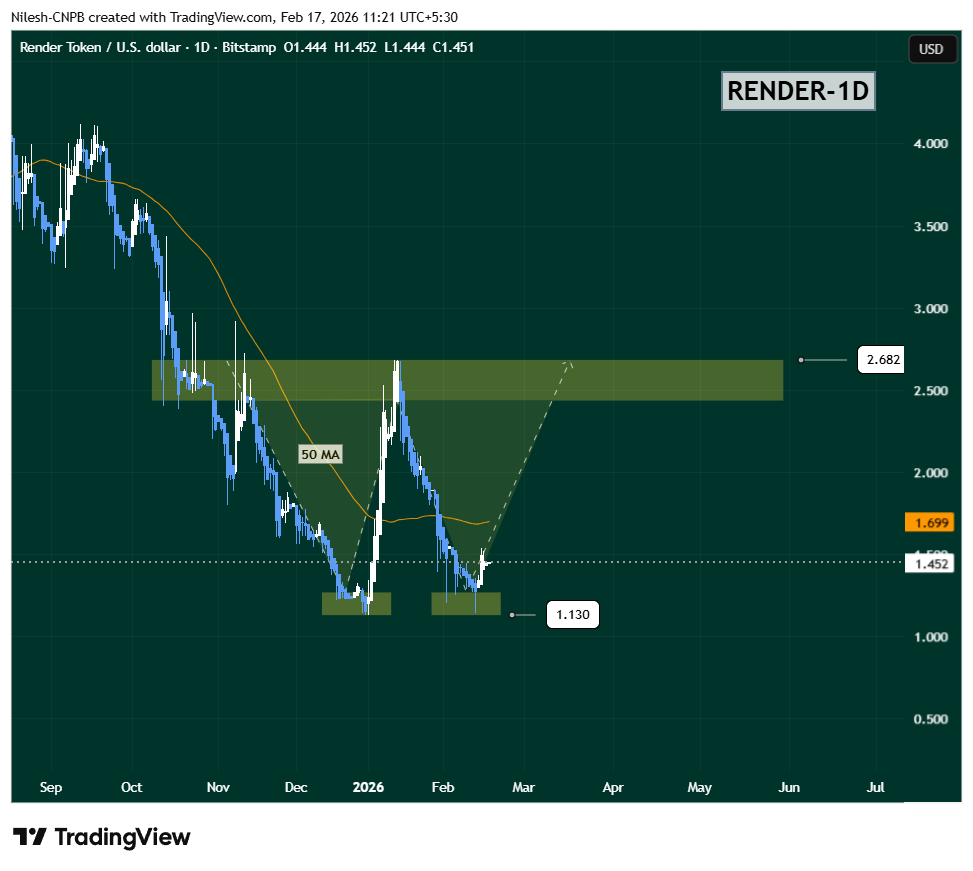
This repeated defense of $1.13 is a key signal. It shows that selling pressure is weakening and demand is building at lower levels. RENDER is now trading around $1.45, indicating early stabilization after the retest.
Adding to this, price is currently attempting to base just below the 50-day moving average, a level that often acts as a momentum switch during trend transitions.
What’s Next for RENDER?
For this bullish structure to gain real credibility, RENDER needs to reclaim the 50-day moving average near $1.69. A sustained move above this level would mark a shift in short-term momentum and increase the odds of a recovery rally.
If buyers manage to push price back toward the $2.62–$2.68 neckline zone, that area will become the next major test. A clean breakout above this resistance — ideally followed by a successful retest — would confirm the double bottom pattern and could open the door for a stronger upside move in the weeks ahead.
On the downside, the $1.13 support zone remains the most critical level to watch. A breakdown below this area would invalidate the bullish setup and likely expose RENDER to another leg lower or extended consolidation.
Disclaimer: The views and analysis presented in this article are for informational purposes only and reflect the author’s perspective, not financial advice. Technical patterns and indicators discussed are subject to market volatility and may or may not yield the anticipated results. Investors are advised to exercise caution, conduct independent research, and make decisions aligned with their individual risk tolerance.
About Author: Nilesh Hembade is the Founder and Lead Author of Coinsprobe, with over 5 years of experience in the cryptocurrency and blockchain industry. Since launching Coinsprobe in 2023, he has been providing daily, research-driven insights through in-depth market analysis, on-chain data, and technical research.
The opinions and market insights shared on CoinsProbe represent the views of individual authors based on prevailing market conditions at the time of publication. Cryptocurrency investments carry significant risk and volatility. Readers are encouraged to conduct their own research and seek professional financial advice before making investment decisions. CoinsProbe and its contributors do not accept responsibility for financial losses or decisions made based on published content.
CoinsProbe may publish sponsored articles, affiliate links, or promotional collaborations. All sponsored material is clearly labeled to maintain transparency with our audience. Our editorial decisions remain fully independent, and advertising partnerships do not influence reviews, rankings, or published opinions.
Since 2023, CoinsProbe has delivered reliable insights on cryptocurrency, blockchain, and digital assets. Our content is created by experienced researchers and analysts who follow strict editorial standards focused on accuracy, transparency, and credibility. Every article is carefully reviewed and verified using trusted sources and current market data. We provide unbiased analysis and timely updates covering everything from emerging crypto projects to major industry developments.