
Key Takeaways
- ASTER rebounds strongly, gaining nearly 10% as the broader crypto market recovers, with price holding above key support near $0.55.
- Harmonic structure remains bullish in the short term, with the Bearish Shark pattern allowing upside continuation toward resistance.
- A breakout above $0.687 (50-day MA) could open the path toward the $0.828 target, while failure to hold support may invalidate the setup.
The broader cryptocurrency market is showing signs of relief today after a sharp sell-off earlier this week. Bitcoin (BTC) briefly dipped to the $74,000 region before staging a rebound above $78,000, gaining nearly 3% on the day. Ethereum (ETH) has also followed suit, climbing around 4.4% in the past 24 hours.
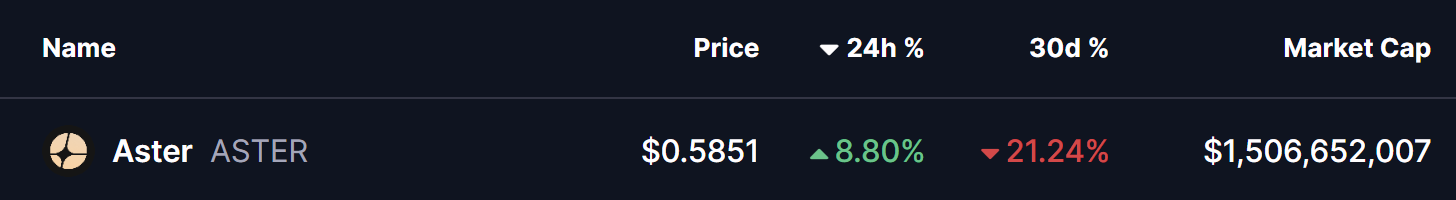
Amid this recovery, several altcoins have turned green, including the decentralized exchange (DEX) token Aster (ASTER). The token has surged over 8%, trimming its monthly losses to around 21%. More importantly, ASTER’s price action is now flashing a familiar technical setup that hints at further upside potential.
Technical Patterns Hint at Upside Momentum
From a technical perspective, ASTER’s daily chart reveals the formation of a Bearish Shark harmonic pattern, a widely tracked structure in harmonic trading. While the pattern is traditionally associated with a possible reversal once fully completed, it often allows for short-term bullish continuation as price advances toward the C-point.
As seen on the chart, the O-X-A-B structure has already been completed, with price finding support near the B-point around the $0.55 region. ASTER is currently trading near $0.584, showing early signs of stabilization after the recent sell-off.
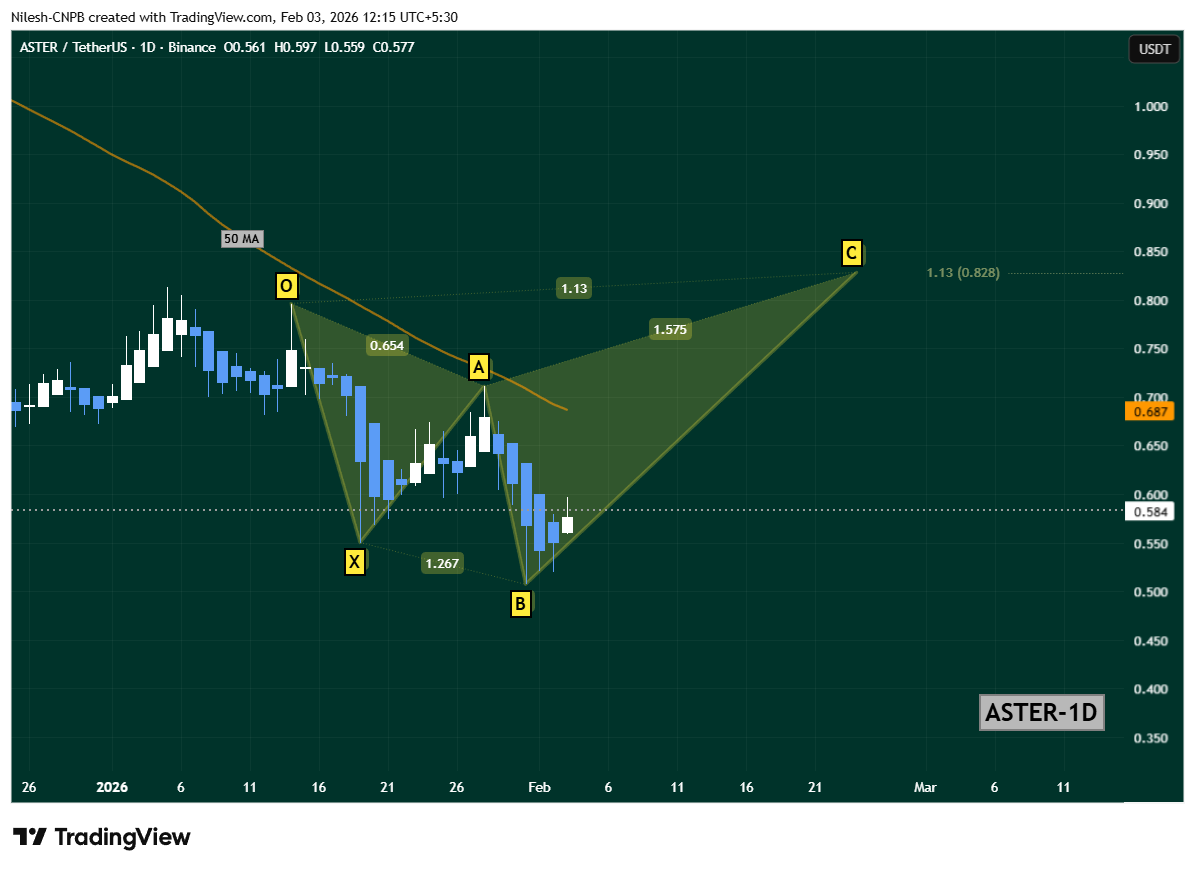
The immediate hurdle for bulls remains the 50-day moving average, positioned around $0.687. This level has acted as a dynamic resistance in recent weeks, capping upside attempts and triggering pullbacks.
What’s Next for ASTER?
A decisive daily close above the 50-day MA ($0.687) would be a key technical signal, strengthening the short-term recovery narrative. Such a breakout could attract fresh momentum buyers and set the stage for a broader upside move.
If bullish momentum sustains, the harmonic projection points toward the C-point near $0.828, which aligns with the 1.13 Fibonacci extension of the Shark pattern. This level represents a potential upside target in the coming sessions, provided overall market sentiment remains supportive.
Despite the improving technical picture, downside risks have not disappeared. A failure to hold the B-point support zone could invalidate the bullish continuation scenario. In that case, ASTER may enter a period of extended consolidation or face renewed downside pressure before any meaningful recovery attempt.
Disclaimer: The views and analysis presented in this article are for informational purposes only and reflect the author’s perspective, not financial advice. Technical patterns and indicators discussed are subject to market volatility and may or may not yield the anticipated results. Investors are advised to exercise caution, conduct independent research, and make decisions aligned with their individual risk tolerance.
About Author: Nilesh Hembade is the Founder and Lead Author of Coinsprobe, with over 5 years of experience in the cryptocurrency and blockchain industry. Since launching Coinsprobe in 2023, he has been providing daily, research-driven insights through in-depth market analysis, on-chain data, and technical research.
The opinions and market insights shared on CoinsProbe represent the views of individual authors based on prevailing market conditions at the time of publication. Cryptocurrency investments carry significant risk and volatility. Readers are encouraged to conduct their own research and seek professional financial advice before making investment decisions. CoinsProbe and its contributors do not accept responsibility for financial losses or decisions made based on published content.
CoinsProbe may publish sponsored articles, affiliate links, or promotional collaborations. All sponsored material is clearly labeled to maintain transparency with our audience. Our editorial decisions remain fully independent, and advertising partnerships do not influence reviews, rankings, or published opinions.
Since 2023, CoinsProbe has delivered reliable insights on cryptocurrency, blockchain, and digital assets. Our content is created by experienced researchers and analysts who follow strict editorial standards focused on accuracy, transparency, and credibility. Every article is carefully reviewed and verified using trusted sources and current market data. We provide unbiased analysis and timely updates covering everything from emerging crypto projects to major industry developments.