
Key Takeaways
- Hyperliquid’s HIP-3 markets recorded a new all-time high daily volume of $4.83B
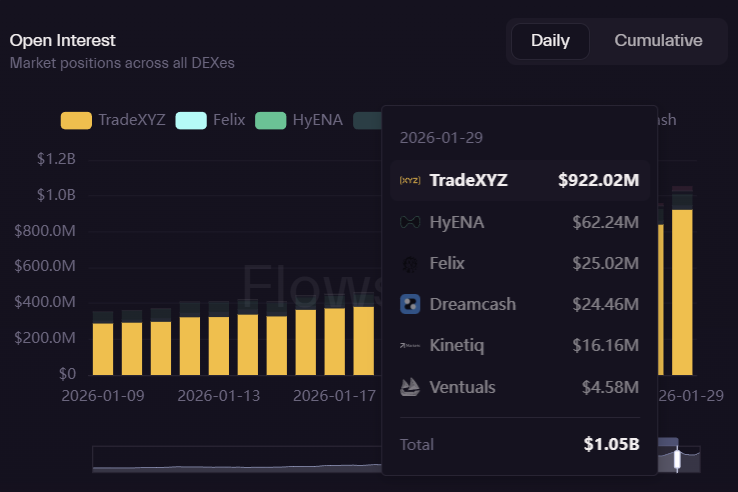
- Open interest surged to a record $1.05B, up sharply from $260M last month
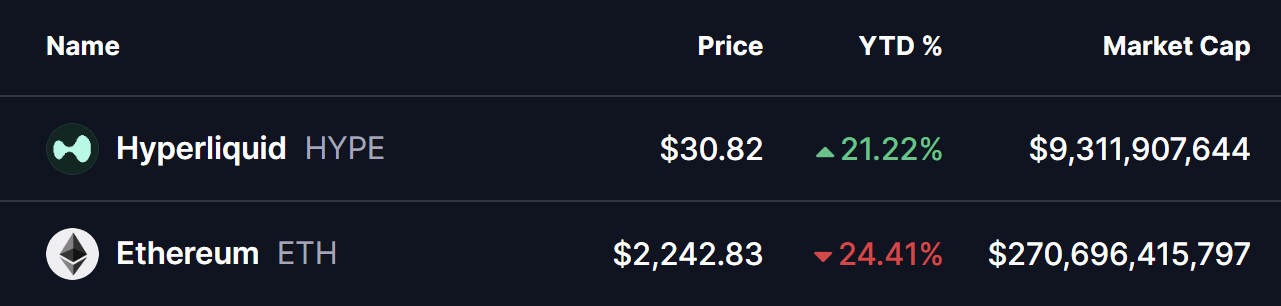
- $HYPE has outperformed the broader crypto market, rising while ETH fell 24% YTD
- The daily chart shows a Bearish Shark harmonic pattern, allowing short-term upside
- A move toward $38.72 remains possible if momentum holds above the 50-day MA
HYPE, the native token of Hyperliquid — one of the fastest-growing decentralized perpetual trading platforms — has continued to show relative strength despite a broader crypto market downturn. While major assets like Ethereum (ETH) have suffered a sharp 24% decline year-to-date, HYPE has managed to stay bullish, posting over 21% gains during the same period.
This divergence has naturally caught traders’ attention. But beyond short-term price action, a deeper look into on-chain growth metrics and technical structure suggests that HYPE’s momentum may be driven by strong underlying fundamentals rather than pure speculation.
Hyperliquid’s HIP-3 Markets Hit Record Activity
According to the latest data from Flowscan, Hyperliquid’s HIP-3 protocol — launched last fall to enable permissionless on-chain markets for assets like gold, silver, and other commodities — has entered a phase of explosive growth.
Over the past week, daily trading volume across HIP-3 markets surged to approximately $4.83 billion, marking a new all-time high. At the same time, open interest (OI) climbed to a record $1.05 billion, fueled largely by rising demand for on-chain commodities exposure.
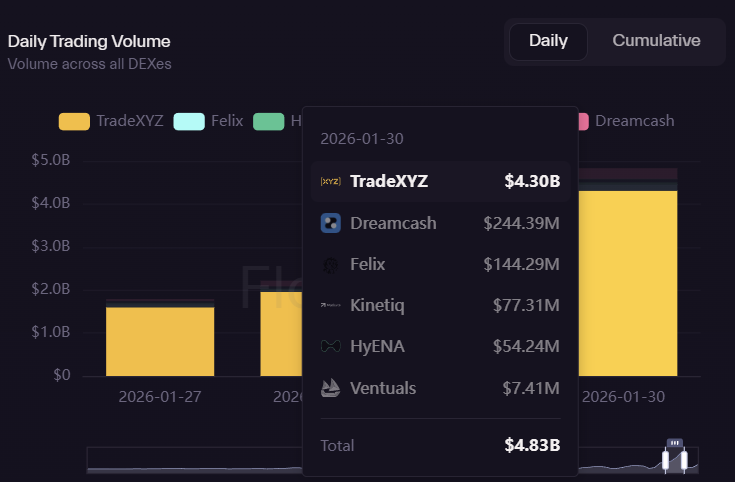
What makes this growth particularly notable is its speed. Just a month ago, HIP-3 open interest hovered near $260 million. Since then, OI has consistently printed new weekly highs, signaling a rapid influx of capital and increasing trader participation within the Hyperliquid ecosystem.
This surge in volume and open interest reflects growing confidence in Hyperliquid’s infrastructure and execution — a dynamic that historically acts as a strong tailwind for the platform’s native token.
$HYPE Technical Structure Signals Room for Upside
From a technical standpoint, HYPE’s daily chart is forming a Bearish Shark harmonic pattern. While the name sounds ominous, this structure often appears during corrective phases and can still allow for short-term bullish continuation before a larger trend decision unfolds.
After completing the O–X–A–B leg, HYPE successfully reclaimed its 50-day moving average, a key signal that short-term momentum has shifted back in favor of buyers. Since then, price has been consolidating near the $30 region, suggesting accumulation rather than distribution.
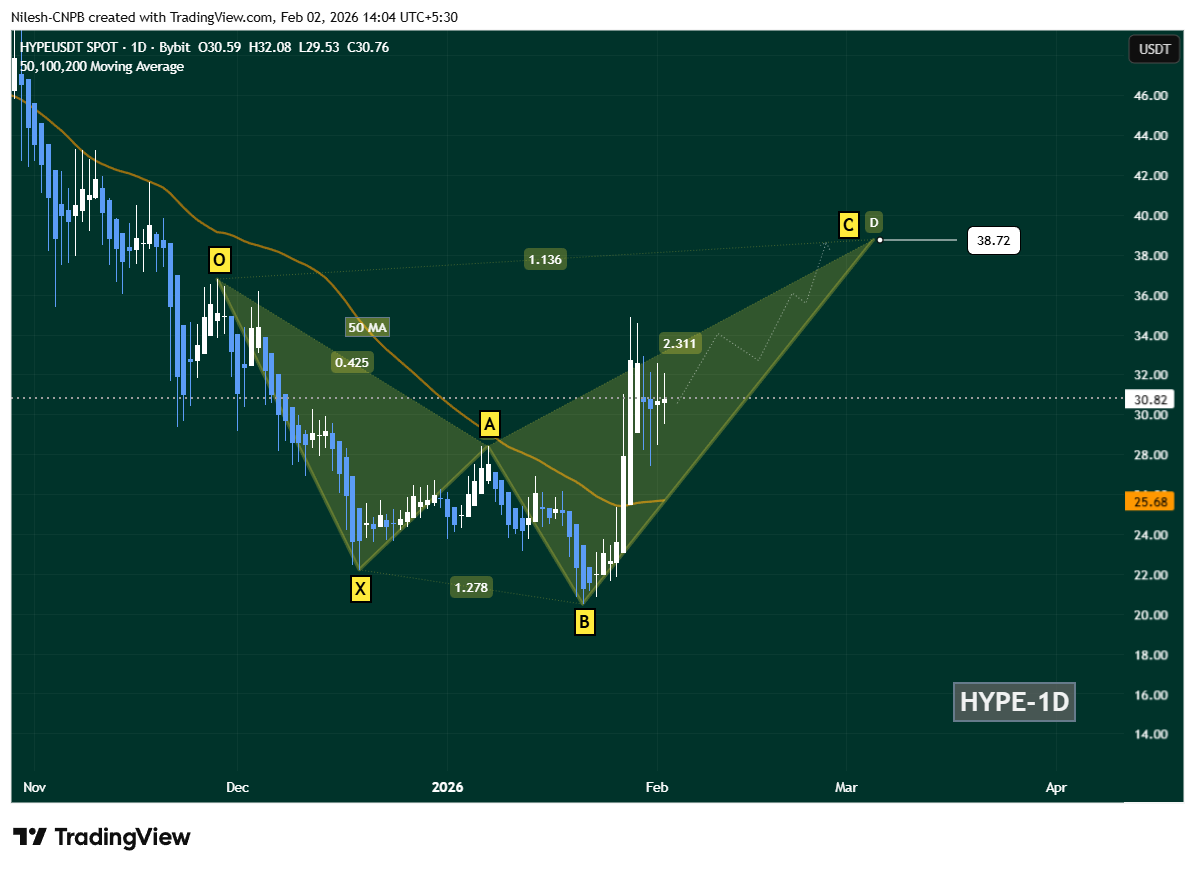
If current momentum holds, HYPE could continue its advance toward the C-point of the Shark pattern near $38.72. This level aligns closely with the 1.13 Fibonacci extension, a common target zone during harmonic pattern development and a logical area for the next technical reaction.
Market Outlook
With HIP-3 markets printing record volumes and open interest expanding at a rapid pace, Hyperliquid’s ecosystem growth appears firmly intact. If on-chain activity continues to scale alongside favorable technical conditions, HYPE may remain one of the stronger relative performers in the current market environment.
For now, traders will be watching whether HYPE can maintain support above the 50-day moving average and build enough momentum to challenge the $38–$40 resistance zone in the coming sessions.
Disclaimer: The views and analysis presented in this article are for informational purposes only and reflect the author’s perspective, not financial advice. Technical patterns and indicators discussed are subject to market volatility and may or may not yield the anticipated results. Investors are advised to exercise caution, conduct independent research, and make decisions aligned with their individual risk tolerance.
About Author: Nilesh Hembade is the Founder and Lead Author of Coinsprobe, with over 5 years of experience in the cryptocurrency and blockchain industry. Since launching Coinsprobe in 2023, he has been providing daily, research-driven insights through in-depth market analysis, on-chain data, and technical research.
The opinions and market insights shared on CoinsProbe represent the views of individual authors based on prevailing market conditions at the time of publication. Cryptocurrency investments carry significant risk and volatility. Readers are encouraged to conduct their own research and seek professional financial advice before making investment decisions. CoinsProbe and its contributors do not accept responsibility for financial losses or decisions made based on published content.
CoinsProbe may publish sponsored articles, affiliate links, or promotional collaborations. All sponsored material is clearly labeled to maintain transparency with our audience. Our editorial decisions remain fully independent, and advertising partnerships do not influence reviews, rankings, or published opinions.
Since 2023, CoinsProbe has delivered reliable insights on cryptocurrency, blockchain, and digital assets. Our content is created by experienced researchers and analysts who follow strict editorial standards focused on accuracy, transparency, and credibility. Every article is carefully reviewed and verified using trusted sources and current market data. We provide unbiased analysis and timely updates covering everything from emerging crypto projects to major industry developments.