
Date: Sun, Dec 07, 2025 | 06:30 AM GMT
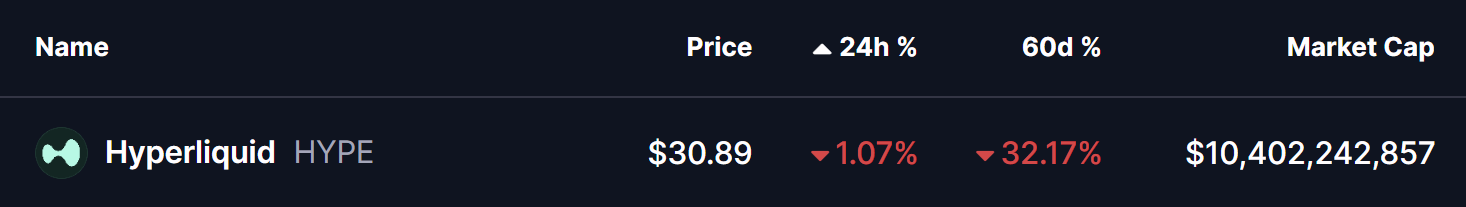
Hyperliquid (HYPE), after printing its all-time high of $59.12 back in Sept 2025, has entered a cooling phase, correcting over 32% in the past two months. While sentiment has shifted from euphoric to cautious, the chart is presenting something far more valuable than noise — a repeating structural formation that strongly echoes Chainlink’s (LINK) mid-2024 fractal recovery.
HYPE Mirrors LINK’s Fractal Setup
A side-by-side fractal comparison between LINK (May 2024) and HYPE (current) reveals an almost identical head-and-shoulder formation followed by a corrective sweep into support.
In LINK’s pattern, after forming the head, the moving average crossover triggered a 29% drop back to its demand block (blue zone). Price then compressed inside a tight consolidation range (green box) before expanding upward to form the right shoulder — initiating the next breakout phase.
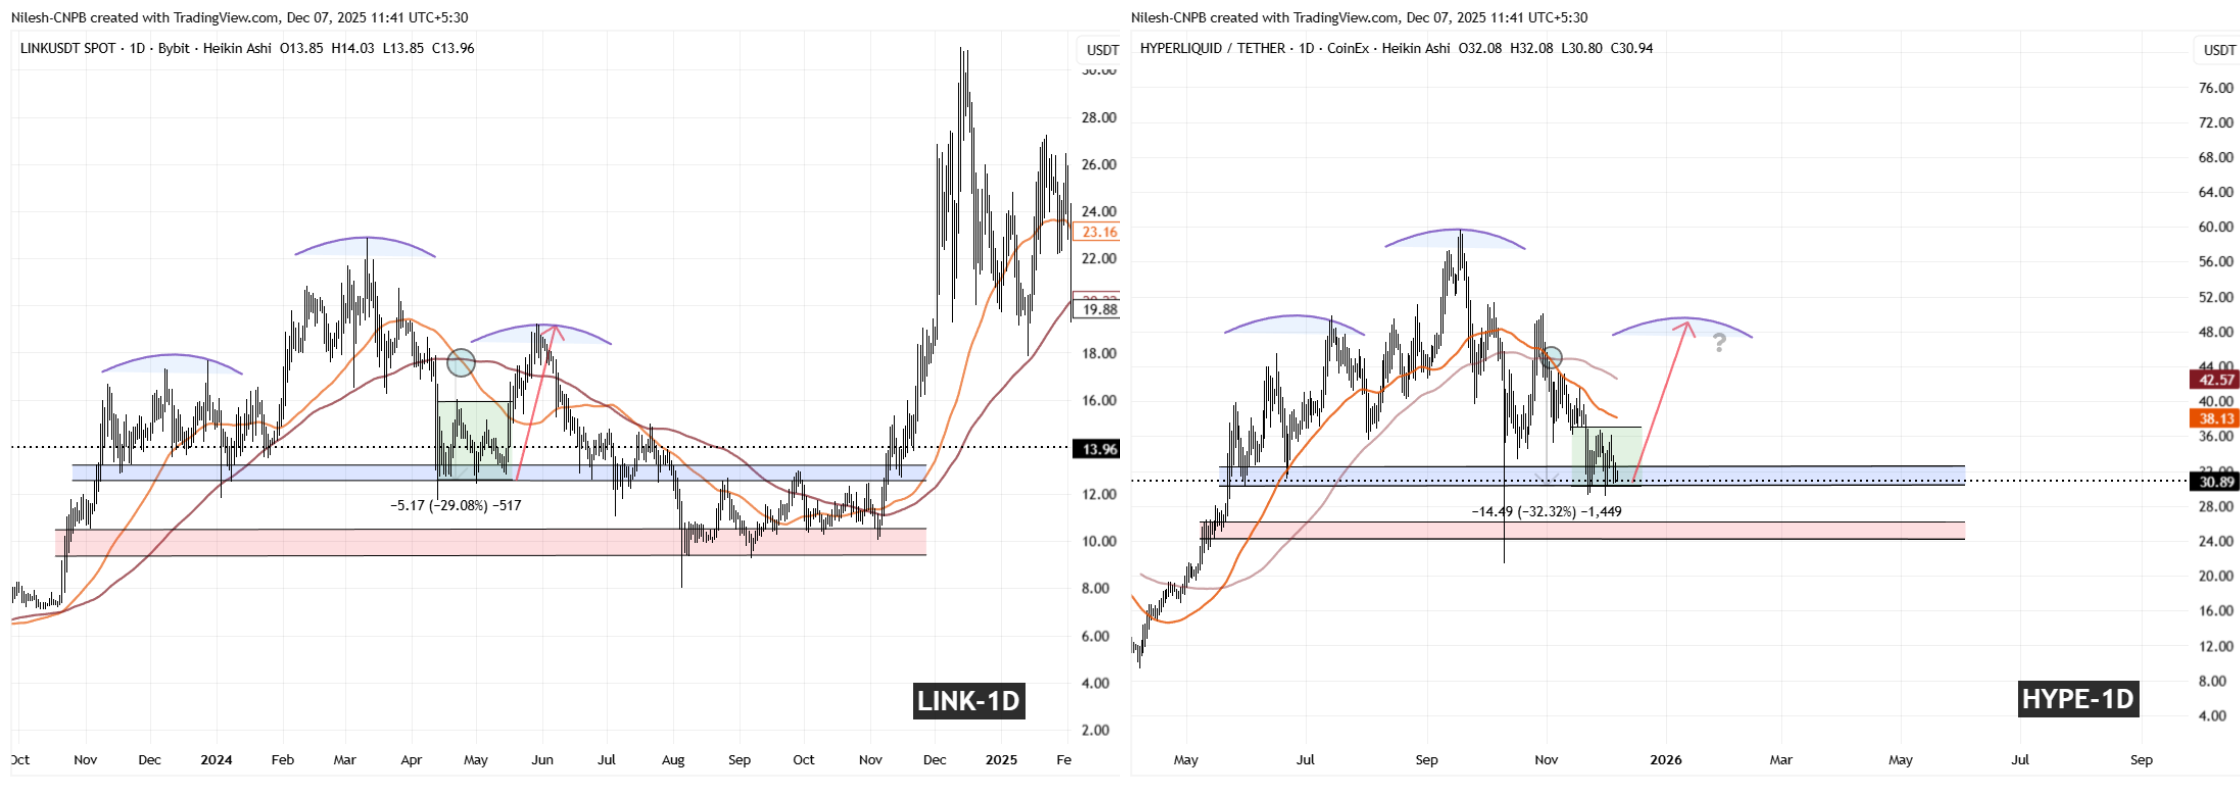
HYPE is now walking the same technical pathway.
A similar MA crossover has occurred right after the peak formation, followed by a 32% pullback directly into the $29.50–$32.50 demand pocket (blue zone). This is the exact price structure confluence that acted as a springboard for LINK’s rebound (green zone).
If the fractal symmetry continues to hold, HYPE is not breaking structure — it is building it.
What’s Next for HYPE?
If buyers continue to defend the $29.09–$32.50 support range, the next key trigger becomes the reclaim of the 50-day MA at $38.13. A successful reclaim could activate a measured upside leg into the $48–$50 region — aligning precisely with the right-shoulder completion zone of LINK.
However, caution remains if price loses the structural floor.
A daily close below $29.09 would begin to weaken the fractal symmetry, opening the chart to a deeper liquidity sweep toward the next downside cushion at $25.00 (red zone). Unlike LINK’s clean rebound, this scenario could extend consolidation before any meaningful upside attempt.
Disclaimer: The views and analysis provided are for informational purposes only and do not constitute financial advice. Chart patterns and historical fractal behaviors are subject to sudden invalidation due to market volatility. Traders should conduct independent research and assess risk tolerance before making any investment decisions.
The opinions and market insights shared on CoinsProbe represent the views of individual authors based on prevailing market conditions at the time of publication. Cryptocurrency investments carry significant risk and volatility. Readers are encouraged to conduct their own research and seek professional financial advice before making investment decisions. CoinsProbe and its contributors do not accept responsibility for financial losses or decisions made based on published content.
CoinsProbe may publish sponsored articles, affiliate links, or promotional collaborations. All sponsored material is clearly labeled to maintain transparency with our audience. Our editorial decisions remain fully independent, and advertising partnerships do not influence reviews, rankings, or published opinions.
Since 2023, CoinsProbe has delivered reliable insights on cryptocurrency, blockchain, and digital assets. Our content is created by experienced researchers and analysts who follow strict editorial standards focused on accuracy, transparency, and credibility. Every article is carefully reviewed and verified using trusted sources and current market data. We provide unbiased analysis and timely updates covering everything from emerging crypto projects to major industry developments.