
Date: Thu, Oct 23, 2025 | 10:01 AM GMT
The broader cryptocurrency market continues to show an encouraging tone today, with Bitcoin (BTC) and Ethereum (ETH) both trading over 1% higher, setting the stage for potential upside in several altcoins — including Pump Fun (PUMP).
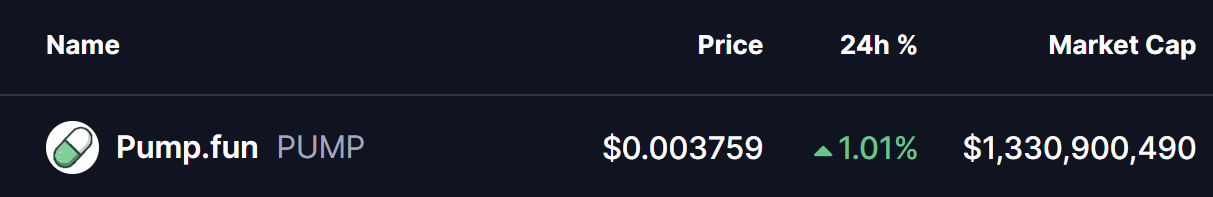
PUMP is back in green with modest intraday gains, and the latest chart setup suggests there might be more upside ahead. A developing harmonic pattern hints that a short-term bullish continuation could be underway.
Harmonic Pattern Hints at Potential Upside
On the 4-hour chart, PUMP appears to be forming a Bearish Butterfly harmonic pattern — a structure that, despite its name, often features a bullish rally during its final CD leg before reaching the completion zone.
The pattern initiated from Point X near $0.004566, followed by a sharp correction to Point A, then a rebound to Point B, and finally a dip to Point C around $0.003414. After establishing this low, PUMP has shown renewed strength and is currently trading around $0.003755, reflecting early signs of buying interest returning to the market.
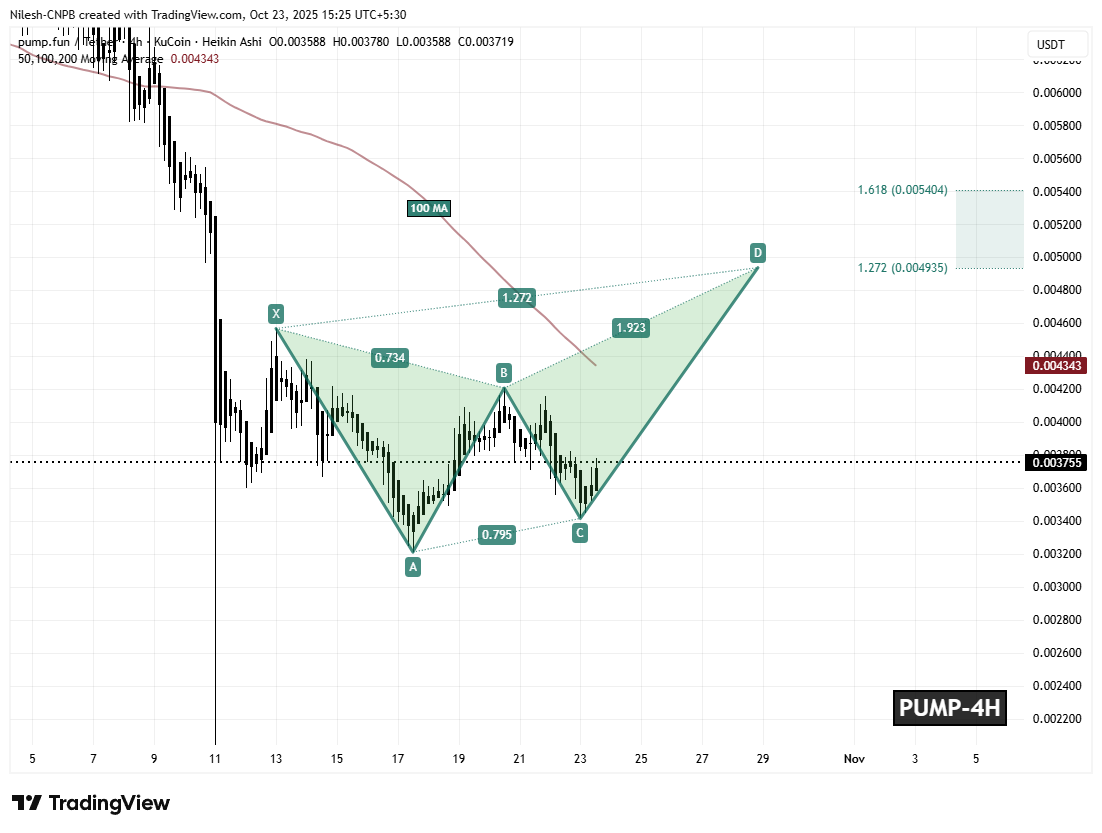
Crucially, the token is hovering just below its 100-hour moving average (MA) at $0.004343, which acts as a key short-term resistance. A decisive breakout and close above this level could flip it into support — confirming the bullish continuation phase of the Butterfly pattern.
What’s Next for PUMP?
If bulls can sustain momentum above the 100-hour MA, the pattern projects a potential rally toward the Potential Reversal Zone (PRZ), located between $0.004935 and $0.005404. These levels align with the 1.272 and 1.618 Fibonacci extensions, both of which have historically marked completion zones for Butterfly patterns before a reversal phase begins.
However, failure to defend the C-level support at $0.003414 could invalidate the pattern, opening the door for a short-term pullback toward the $0.0031–$0.0030 range before any rebound attempt.

Disclaimer: The views and analysis presented in this article are for informational purposes only and reflect the author’s perspective, not financial advice. Technical patterns and indicators discussed are subject to market volatility and may or may not yield the anticipated results. Investors are advised to exercise caution, conduct independent research, and make decisions aligned with their individual risk tolerance.
The opinions and market insights shared on CoinsProbe represent the views of individual authors based on prevailing market conditions at the time of publication. Cryptocurrency investments carry significant risk and volatility. Readers are encouraged to conduct their own research and seek professional financial advice before making investment decisions. CoinsProbe and its contributors do not accept responsibility for financial losses or decisions made based on published content.
CoinsProbe may publish sponsored articles, affiliate links, or promotional collaborations. All sponsored material is clearly labeled to maintain transparency with our audience. Our editorial decisions remain fully independent, and advertising partnerships do not influence reviews, rankings, or published opinions.
Since 2023, CoinsProbe has delivered reliable insights on cryptocurrency, blockchain, and digital assets. Our content is created by experienced researchers and analysts who follow strict editorial standards focused on accuracy, transparency, and credibility. Every article is carefully reviewed and verified using trusted sources and current market data. We provide unbiased analysis and timely updates covering everything from emerging crypto projects to major industry developments.