Date: Thu, Jan 30, 2025, 07:39 AM GMT
The cryptocurrency market is experiencing positive momentum today as Bitcoin (BTC) surged by 3%, reclaiming the $105K mark. This move follows the Federal Reserve’s decision to maintain the federal funds rate at 4.25%-4.50%.
Following BTC’s lead, top altcoins including Hyperliquid (HYPE) and Ondo (ONDO) are gaining attention, with impressive 9% and 12% gains in the past 24 hours.

With these gains, both tokens are now approaching key resistance levels after breaking out of falling wedge patterns, and their next moves could determine further upside potential.
Hyperliquid (HYPE)
Hyperliquid (HYPE) has seen strong bullish momentum after breaking out of a falling wedge pattern near $21.75 on January 14. However, following the breakout, the price retested the trendline and consolidating around the 25-day simple moving average (SMA).

Today, HYPE has climbed to $25.83, now approaching a key horizontal resistance zone of $26.20 – $27. If HYPE breaks above $27, it could target the next next resistance levels at $29.31 and $35.37, representing a 30% potential gain from the resistance breakout.
The MACD (Moving Average Convergence Divergence) is showing bullish momentum, with the histogram turning positive and the MACD line crossing above the signal line. The RSI (Relative Strength Index) remains below overbought levels, suggesting there is still room for further upside.

Ondo (ONDO)
Similar to HYPE, Ondo (ONDO) has been on a strong uptrend after breaking out of a falling wedge pattern near $1.21 on January 18. After the breakout, the price retested the trendline and consolidating above the 100-day SMA.
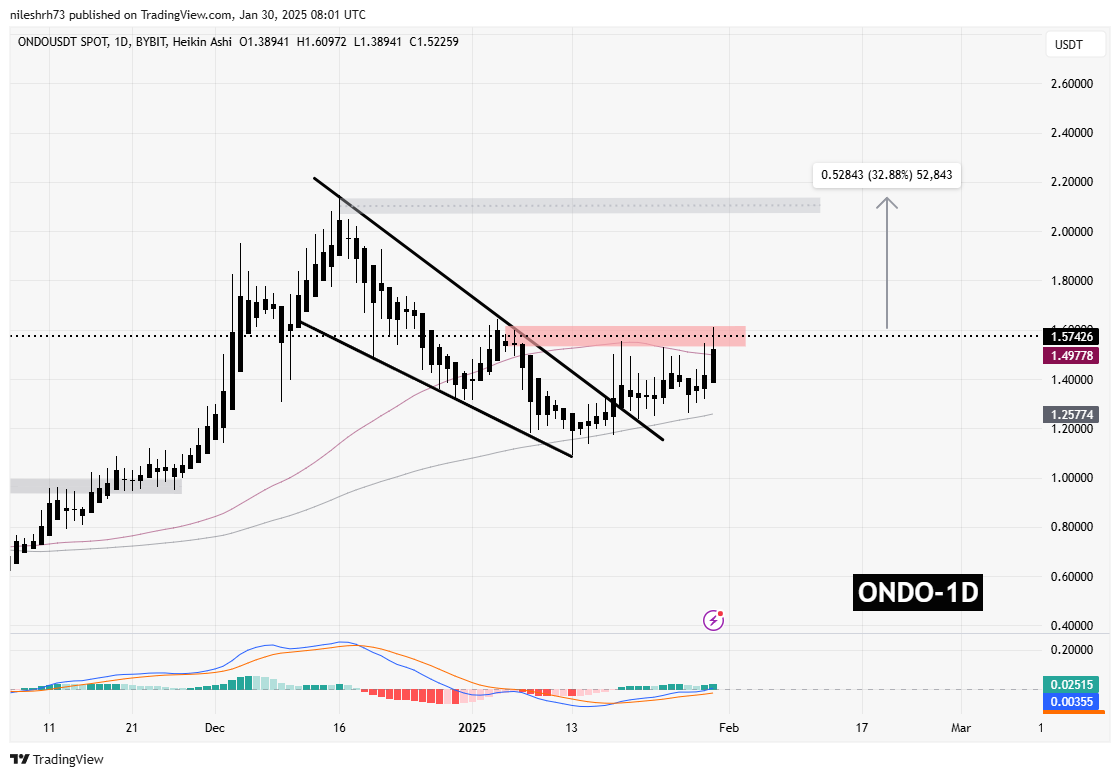
Today, ONDO has climbed to $1.57, breaking past the 50-day SMA and entering a key horizontal resistance zone between $1.53 and $1.62. If ONDO breaks above $1.62, the next major resistance level is $2.14, which could result in a 32% gain from resistance.
The MACD is turning bullish, with the signal line curling upward. The RSI remains in a neutral zone, indicating that ONDO has further upside potential before becoming overbought.
What’s Ahead?
With both HYPE and ONDO approaching key resistance levels, traders should watch for potential breakouts above these zones. Bitcoin’s continued strength could provide further momentum for altcoins, helping these tokens extend their rallies.
However, failure to break resistance could lead to short-term pullbacks.

Disclaimer: This article is for informational purposes only and not financial advice. Always conduct your own research before investing in cryptocurrencies.
The opinions and market insights shared on CoinsProbe represent the views of individual authors based on prevailing market conditions at the time of publication. Cryptocurrency investments carry significant risk and volatility. Readers are encouraged to conduct their own research and seek professional financial advice before making investment decisions. CoinsProbe and its contributors do not accept responsibility for financial losses or decisions made based on published content.
CoinsProbe may publish sponsored articles, affiliate links, or promotional collaborations. All sponsored material is clearly labeled to maintain transparency with our audience. Our editorial decisions remain fully independent, and advertising partnerships do not influence reviews, rankings, or published opinions.
Since 2023, CoinsProbe has delivered reliable insights on cryptocurrency, blockchain, and digital assets. Our content is created by experienced researchers and analysts who follow strict editorial standards focused on accuracy, transparency, and credibility. Every article is carefully reviewed and verified using trusted sources and current market data. We provide unbiased analysis and timely updates covering everything from emerging crypto projects to major industry developments.