Date: Tue, Nov 12, 2024, 12:52 PM GMT
The cryptocurrency market kicked off the day with impressive gains, as Bitcoin (BTC) reached a new all-time high of $89,956. However, BTC soon faced a healthy correction after a massive 25% rally over the past week, and it’s now consolidating around the $87,000 mark.
This correction has impacted major memecoins as well, including Neiro Ethereum (NEIRO), which saw a nearly 10% decline in the last 24 hours and a total drop of 30% over the past month.

Despite the bullish sentiment in the broader market, NEIRO seems to be struggling to establish a solid uptrend, repeatedly showing signs of a breakout but ultimately pulling back each time.
Signs of Breakout but Persistent Pullbacks
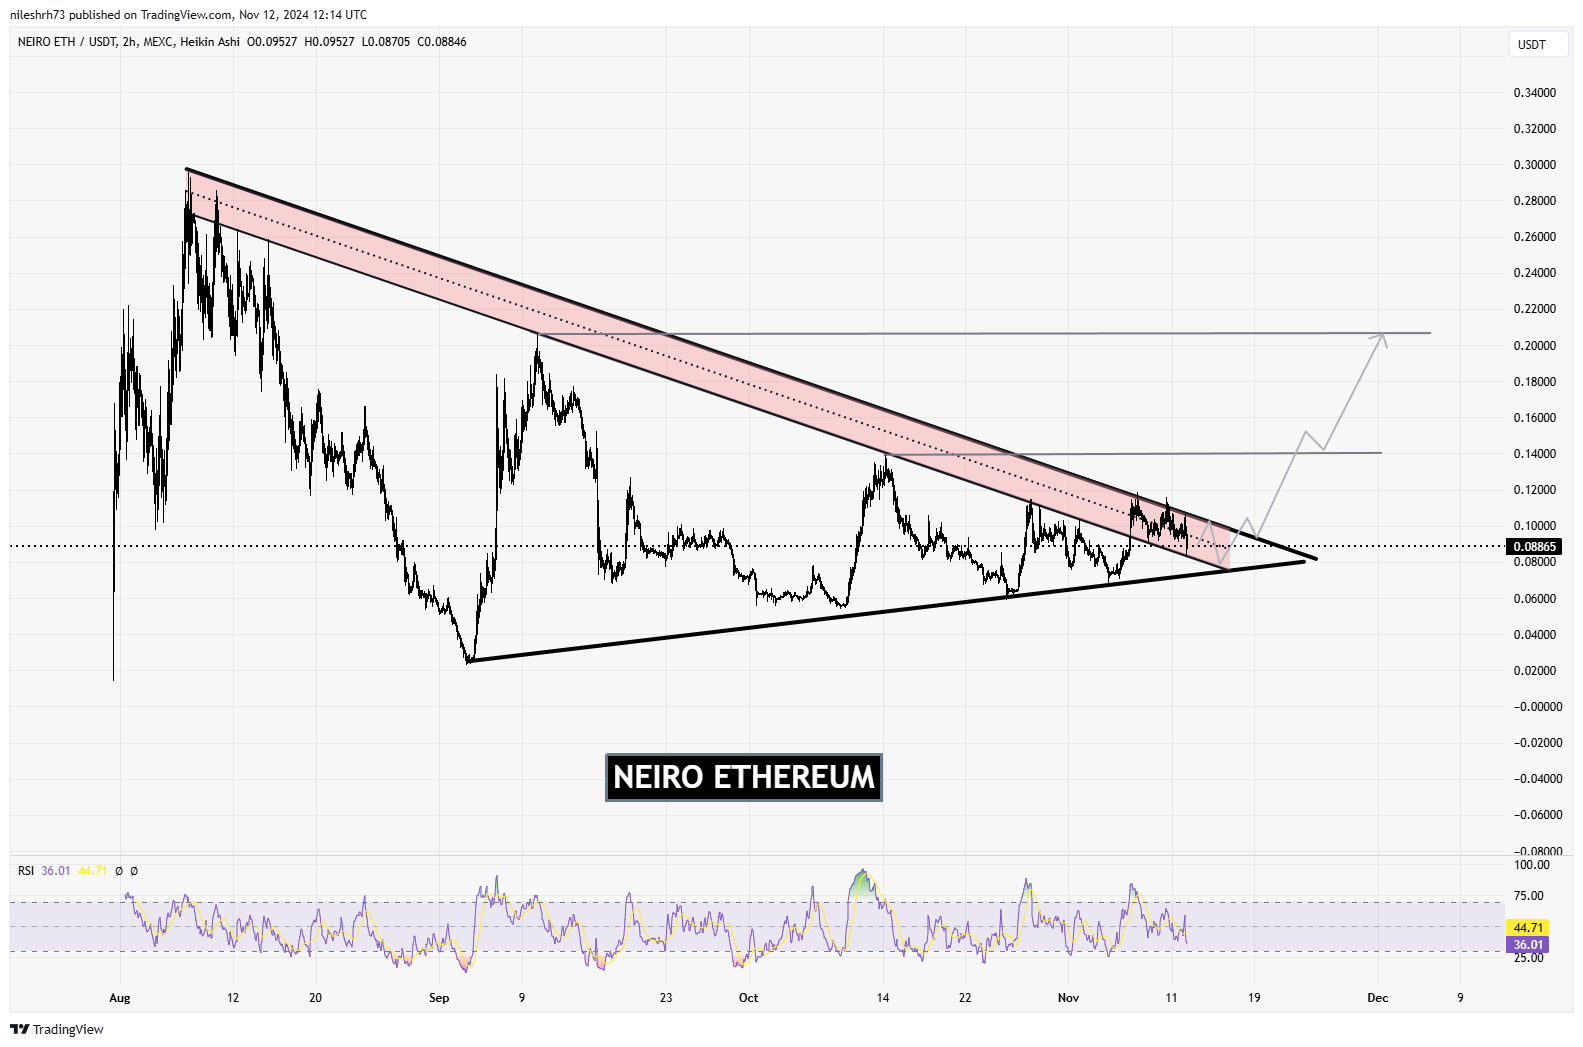
While the market, including many memecoins, has been rallying, Neiro Ethereum (NEIRO) has not followed suit as expected. Since November 7, NEIRO has attempted to break out of its current range three times but has faced rejection each time, leading to further declines. Despite the bullish undertone in the market, NEIRO’s price action is stuck in a pattern of false breakouts, testing investors’ patience.
Technical Analysis
NEIRO’s price has been forming a symmetrical triangle pattern since August, marked by a series of lower highs and higher lows. This structure typically indicates a buildup of momentum that could lead to a significant breakout in either direction. The chart shows that NEIRO has been testing the upper boundary of the triangle pattern, only to pull back each time.

The key resistance level around $0.10 has proven to be a strong barrier, preventing NEIRO from breaking out decisively. On the downside, the support level at $0.08 downtrendline of the red channel has held firm, preventing further declines. This creates a narrow range in which NEIRO has been consolidating, suggesting that a breakout—in either direction—may be imminent.
What’s Ahead for NEIRO?
The next major move for NEIRO largely depends on its ability to break out of this symmetrical triangle pattern:
1.Bullish Scenario: A breakout above the upper trendline resistance at $0.10, especially if backed by strong trading volume, could lead to a fresh rally. In this case, NEIRO could target the next resistance levels at $0.14 and $0.18, representing a potential upside of over 50% from the current price. Such a breakout would align with the overall bullish momentum in the market and attract more buying interest.
2.Bearish Scenario: If NEIRO fails to hold the support level at $0.08 and breaks down from the triangle, it could signal a potential downturn. In this scenario, NEIRO may retest lower support zones, possibly near $0.069. This would indicate a continuation of the downtrend despite the positive sentiment in the broader market.
The Relative Strength Index (RSI) for NEIRO is currently at 36, suggesting that it is moderately oversold. This level could indicate that selling pressure is easing, potentially paving the way for a reversal if buying volume picks up. However, the RSI would need to move above 50 to confirm a bullish shift in momentum.
Summary
NEIRO’s inability to break out despite the bullish market is a point of concern. However, the symmetrical triangle pattern suggests that a decisive move could be on the horizon. Investors should keep a close eye on the $0.10 resistance and $0.08 support levels, as a breakout above or below these thresholds will likely determine NEIRO’s direction in the near term.
Disclaimer: This article is for informational purposes only and not financial advice. Always conduct your own research before investing in cryptocurrencies.


